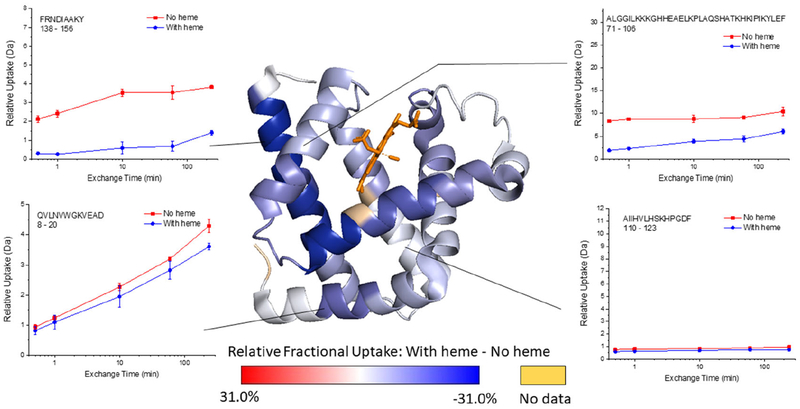
Figure 1.
Representative deuterium uptake plots for myoglobin (i.e. with heme) and apomyoglobin (i.e. without heme), and the relative fractional uptake (at the 4 h exchange time point) mapped onto the holo myoglobin structure (PDB 1DWR). The darker the blue color on the structure, the more the HDX decreases upon heme binding. Calculations of the Relative Fractional Uptake of deuterium, as mapped on the protein structure, were performed using the Waters DynamX software (see the Supporting Information for more details).

