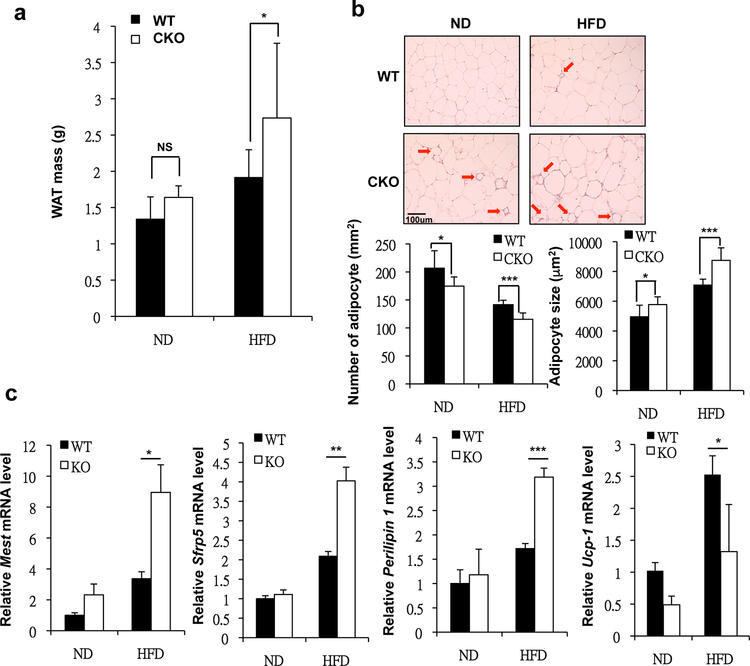
Fig. 2. CKO mice presented WAT hypertrophy and inflammation.
(a) Average visceral WAT (vWAT) tissue mass of ND- or HFD-fed WT and CKO mice. (b) Top, H&E staining of vWAT of ND- or HFD-fed WT and CKO mice. Scale bar: 100 μm. Bottom, adipocytes per square millimeter and average adipocyte size of ND- or HFD-fed WT and CKO mice. (c) qPCR of Mest, Srfp5, Perilipin 1 and Ucp-1 mRNA levels in vWAT. Results are presented as mean ±SE; n=6 mice per group. * p < 0.05, ** p < 0.01; *** p < 0.001 compared to WT group.

