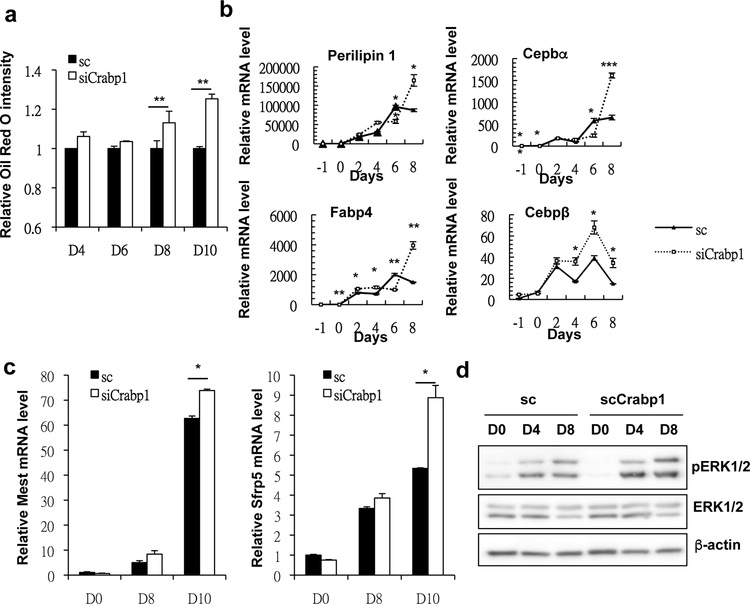
Fig. 3. Silencing Crabp1 led to fat accumulation and hypertrophy in adipocytes.
(a) Oil red O staining of 3T3L1 differentiated adipocytes. Results are presented as oil red O intensity (optical density) normalized to the sc D0 group. (b) qPCR of Perilipin 1, Cebpa, and Fabp4 mRNA levels. (c) qPCR of Mest and Sfrp5 mRNA levels. (d) Western blots of phospho ERK1/2 (pEKR1/2), total ERK1/2 and β-actin protein levels. All experimental data were collected from 3T3L1-differentiated adipocytes with or without silencing Crabp1 on designated days. Results are presented as mean ±SE. * p < 0.05, ** p < 0.01; *** p < 0.001 compared to sc group; sc, scramble control; siCrabp1, silencing Crabp1.

