Figure A1.

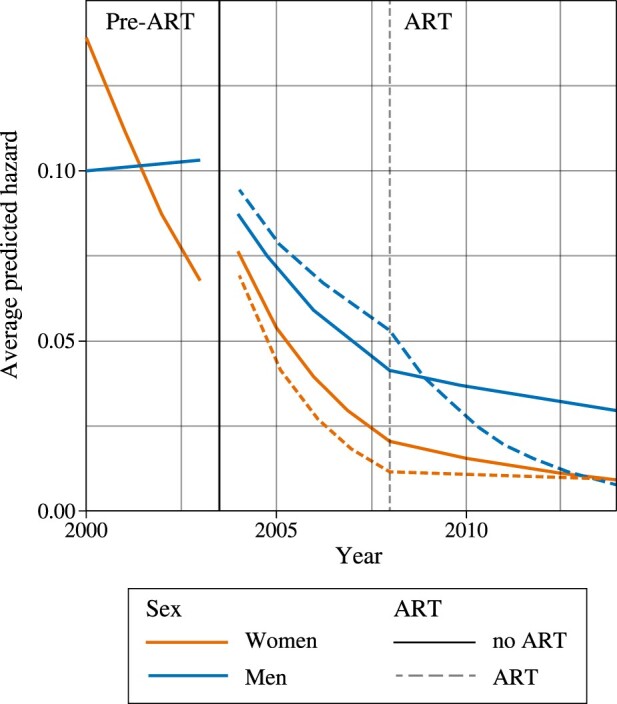
Model-predicted hazard of mortality for HIV-positive individuals by sex, calendar year, and ART status, Uganda 2000–14
Note: Dashed vertical line at 2008 represents the spline inflection in the model. Source: As for Figure 1.

Model-predicted hazard of mortality for HIV-positive individuals by sex, calendar year, and ART status, Uganda 2000–14
Note: Dashed vertical line at 2008 represents the spline inflection in the model. Source: As for Figure 1.