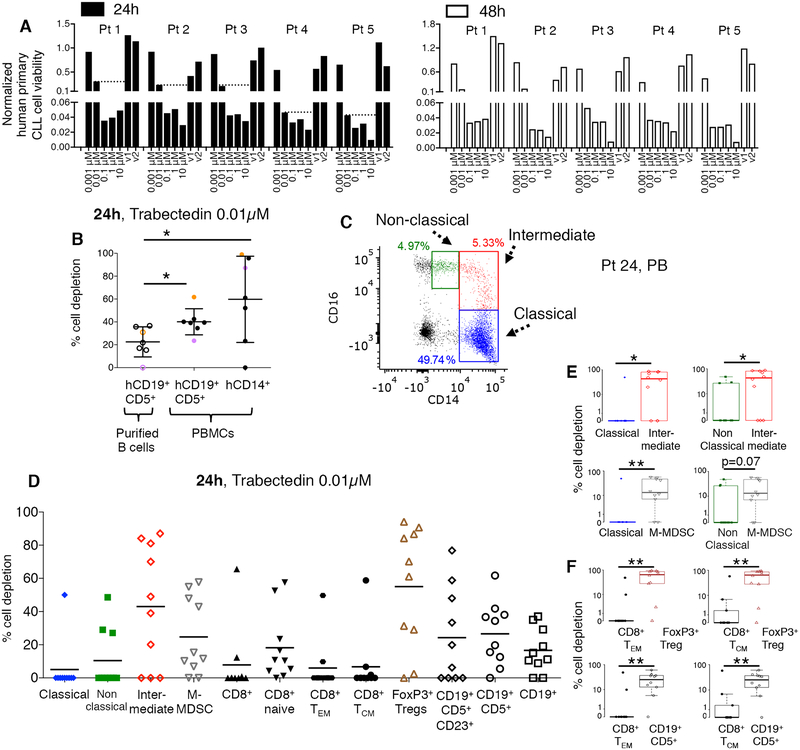
Figure 1. Trabectedin depletes selected human primary lymphoid and myeloid cells.
(A) Human primary CLL cells obtained from CLL patients (n=5, patients 1–5, Supplementary Table S1) were incubated with increasing concentrations of trabectedin (or with vehicle (DMSO v1, v2) and subjected to a luminescent assay at 24 and 48 hours to assess the cells’ sensitivity to the drug. Cell viability of each sample was normalized to its control. Dot lines indicate CLL cell viability at 0.01μM trabectedin. (B) The percentage of depletion of hCD19+ CD5+ cells (plated alone, empty circles; plated with total PBMCs, black circles) and hCD14+ cells (plated with total PBMCs, black circles) after 24h of treatment (n=7, patients 6–12, Supplementary Table S1) with 0.01μM of trabectedin was analyzed by flow cytometry Purple and orange dots identify two representative CLL patients. *p<0.05, Student’s t test. (C) Monocytes were identified as CD14+ CD16++ non classical (green), CD14++ CD16+ intermediate (red) and CD14++ CD16− classical (blue) subsets. A representative PB sample from CLL patient 24 (Supplementary Table S2) is described. (D) Classical monocytes, non classical monocytes, intermediate monocytes, and hCD14+HLADRlow/− M-MDSCs cell depletion and CD8+ T cell, naïve T cell, hCD8+ TCM, hCD8+ TEM, regulatory hCD4+CD25+Foxp3+ Treg, hCD19+, hCD19+CD5+, and hCD19+CD5+CD23+ lymphoid cell depletion (n=10; patients 20–26, 45, 48, and 49, Supplementary Table S2) after 24 h of treatment with 0.01μM of trabectedin were analyzed by multi-color flow cytometry and calculated by the formula described in the Methods. The statistical analysis is described in Supplementary Tables S11 and S12: (E-F) An alternate presentation of the distribution of data from D showing selected paired-cell type comparisons is depicted by box and whisker plots. P value is given by Mann-Whitney-Wilcoxon test, *p < 0.05, **p < 0.01.

