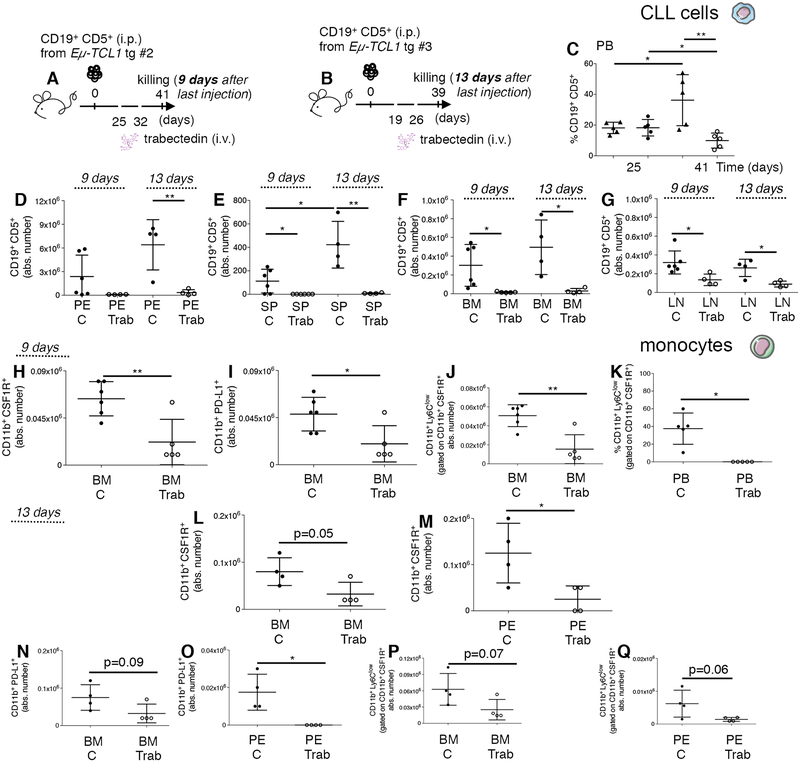
Figure 5. Long-term impact of trabectedin on leukemic cells and on monocytes in the TCL1 tg transplantation system.
(A) C57BL/6 mice intraperitoneally (i.p.) transplanted with leukemic B cells from Eμ-TCL1 transgenic mouse donor #2, left untreated (n=6, black circles) or treated (day +25, +32) with 0.15mg/Kg i.v. of trabectedin (n=5, white circles) were killed on day 41 (9 days after the last injection of trabectedin) and analyzed by flow cytometry. (B) C57BL/6 mice i.p. transplanted with leukemic B cells from Eμ-TCL1 transgenic mouse donor #3, left untreated (n=4, black circles) or treated (day +19, +26) with 0.15mg/Kg i.v. of trabectedin (n=4, white circles) were killed on day 39 (13 days after the last injection of trabectedin) and analyzed by flow cytometry. (C) The mean value ± SD of the relative contribution of CD19+ CD5+ cells to the whole B cell pool over time in PB of mice described in (A) is shown in the graph. (D) The mean value ± SD of the absolute number of CD19+ CD5+ cells gated on CD19+ in PE, (E) in SP, (F) in the BM and (G) LN of mice described in (A) and (B) is shown in graphs. (H) The mean value ± SD of the absolute number of CD11b+ CSF1R+ cells gated on CD45+ in BM of mice described in (A) is shown in graph. (I) The mean value ± SD of the absolute number of CD11b+ PDL1+ cells to the whole monocyte pool (CD11b+ CSF1R+) gated on CD45+ in BM of mice described in (A) is shown in graph. (J) The mean value ± SD of the absolute number of CD11b+ Ly6Clow monocyte subset gated on CD45+ in the BM of mice described in (A) is shown in graph. (K) The mean value ± SD of the relative contribution of the CD11b+ Ly6Clow monocyte subset gated on CD45+ in the PB of mice described in (A) is shown in graph. (L) The mean value ± SD of the absolute number of CD11b+ CSF1R+ cells gated on CD45+ in BM and (M) PE of mice described in (B) is shown in graphs. (N) The mean value ± SD of the absolute number of CD11b+ PD-L1+ cells to the whole monocyte pool (CD11b+ CSF1R+) gated on CD45+ in BM and (O) PE of mice described in (B) is shown in graphs. (P) The mean value ± SD of the absolute number of the CD11b+ Ly6Clow monocyte subset gated on CD45+ in the BM and (Q) PE of mice described in (B) is shown in graphs. *p < 0.05, **p < 0.01, ***p < 0.001, Student t test.

