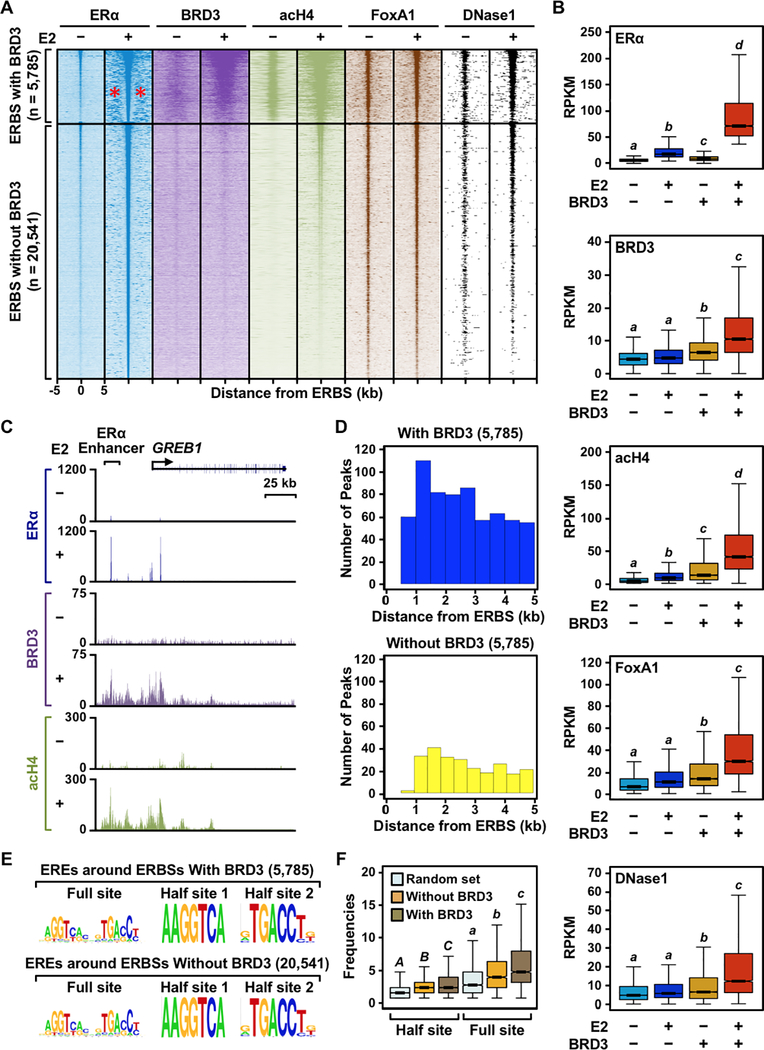
Figure 6. BRD3 is enriched at a subset of ERα binding sites that are associated with active enhancer marks.
(A) Heatmap representations of ERα, BRD3, acetyl H4, and FoxA1 ChIP-seq and DNase-seq reads surrounding ERα peaks. ERα binding sites were divided into two groups, with or without BRD3 enrichment, based on the presence of significant BRD3 ChIP-seq peaks within ± 500 bp of an ERα binding site. The genomic locations relative to the center of the ERBSs are indicated on the bottom of ERα −E2 column; although not shown, the same scales were used for the remaining datasets. The red asterisks in the ERα −E2 condition for the ERBSs with BRD3 enrichment indicate the presence of ‘satellite’ ERα binding sites.
(B) Box plots of ERα, BRD3, acetyl H4, and FoxA1 ChIP-seq and DNase-seq read counts 1 kb surrounding ERα peaks with or without BRD3 enrichment. Box plots marked with different letters (a, b, c, d) are significantly different from each other (p < 0.05; Wilcoxon rank-sum test).
(C) Genome browser tracks of ERα, BRD3, and acH4 ChIP-seq data at the GREB1 locus which has ERα binding sites enriched with BRD3.
(D) The number of ERα peaks surrounding ERα binding sites with or without BRD3 enrichment (satellite ERBSs) binned based on the distance from the BRD3-enriched or -unenriched ERα binding sites.
(E) The quality of ERE sequences does not affect the clustering of ERBSs enriched with BRD3. Motifs enriched under satellite ERBSs surrounding the central ERα binding sites with or without BRD3 enrichment.
(F) The quantity of ERα binding motifs (EREs) governs clustering of ERBSs enriched with BRD3. Box plots showing the frequencies of full or half ERα binding motifs within 10 kb of ERα binding sites with or without BRD3 enrichment. Box plots marked with different letters [(A,B,C) and (a, b, c)] are significantly different from each other within the same motif (p < 2.2 × 10⁻¹⁶; Wilcoxon rank-sum test).

