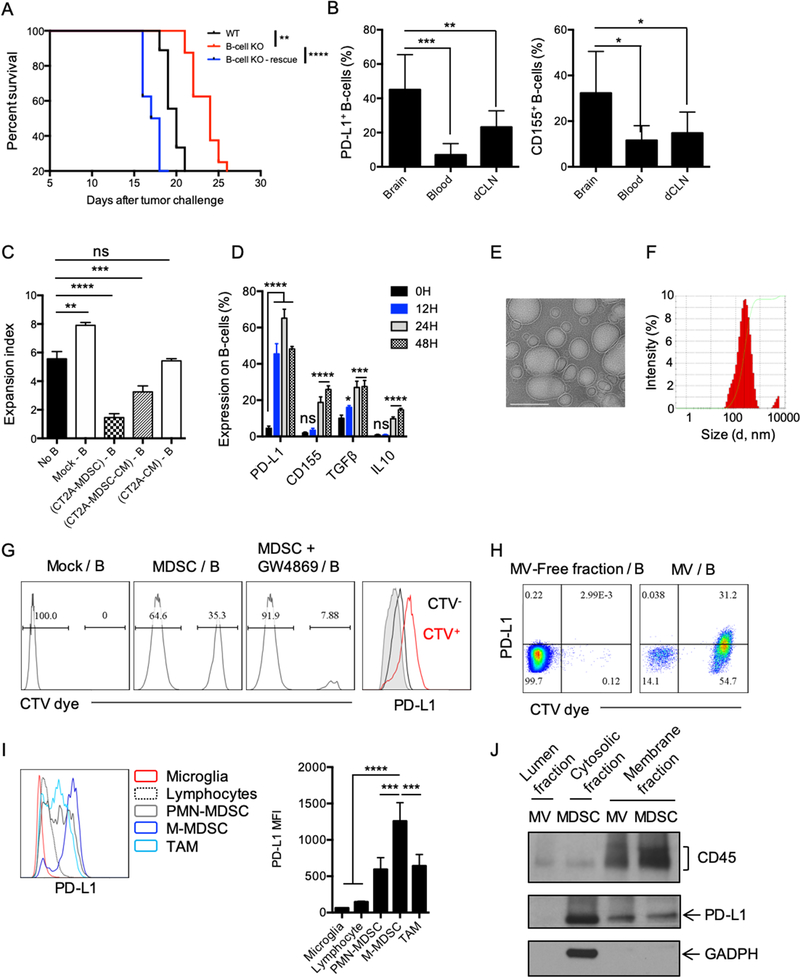
Figure 4. MDSC converts naïve B-cells into Bregs via microvesicles.
(A) Survival of CT2A-bearing, B cell–deficient mice (B-cell KO) vs. C57BL/6 (WT) mice. 5×10⁶ naïve B-cells were adoptively transferred into B-cell KO mice (B-cell KO–rescue) and B-cell KO or WT groups (n=10mice/group). Survival curves were compared by log-rank test and multiple comparisons were adjusted using Bonferroni method. (B) B cell–deficient mice were injected with 5×10⁶ B cells 7 days after tumor implantation and B-cell phenotype was analyzed 3 days after. Percentage of PD-L1+ and CD155+ B cells in the brain, blood, or in the deep cervical lymph nodes (dCLNs) were assessed in n=4 mice/group. Differences were assessed by one-way ANOVA with Tukey’s multiple comparison test. (C) MDSCs were generated using CT2A–conditioned media (CM) for 6 days in the presence of GM-CSF (CT2A-MDSC). CT2A-MDSCs were then cultured at 1:1 ratio with naïve B cells ((CT2A-MDSC)-B). CT2A-MDSCs were cultured alone for 4 days. Supernatants were collected (CT2A-MDSC-CM). Naïve B cells were incubated with ½ CT2A-MDSC-CM + ½ complete RPMI ((CT2A-MDSC-CM) – B). Naïve B cells were incubated with ½ CT2A-CM + ½ complete RPMI ((CT2A-CM) – B). All B cells were incubated for 48 hours. B cells alone (Mock B) was also kept 48h as control. B cells were evaluated for suppression of CD8+ T-cell activation. CD8+ T-cell proliferation was measured as expansion index. Differences were assessed by one-way ANOVA with Tukey’s multiple comparison test. (D) CT2A-MDSCs (upper chamber) and B cells (lower chamber) were cultured for different timepoints (12, 24, 48, and 72h) and expression of PD-L1, CD155, TGFβ (LAP), and IL10 was analyzed. The experiment was performed in triplicates and repeated in 2 independent experiments. Each gene expression difference over the time was statistically assessed using one-way ANOVA with Tukey’s multiple comparison test. (E-F) CT2A-MDSCs were cultured in microvesicle (MV)-free media for 4 days at 106 cells/mL. Supernatants were harvested and ultracentrifugation used to eliminate cell debris and apoptotic bodies. MVs were (E) imaged by cryo-electronic microscopy (scale bar 100 nm) and (F) the size distribution of the MVs evaluated by dynamic light scattering (DLS) analysis. (G) CT2A-MDSCs labeled with the lipophilic dye Cell Trace Violet (CTV; upper chamber, MDSCs) and naïve B cells (lower chamber). 48 hours after, B cells were harvested and evaluated for the acquisition of the CTV dye and PD-L1 by flow cytometry. In parallel, CT2A-MDSCs were treated with an extracellular vesicle release inhibitor GW4869 for 5h prior transwell culture (MDSC+GW4869). GW4869 was washed 3 times with complete RPMI before setting the coculture with B cells. (H) CT2A-MDSCs were labeled with the CTV dye and cultured in MV-free media. Supernatants were collected 4 days after. MVs were obtained after ultracentrifugation. The MV-free fraction (last step of centrifugation) was also collected. B cells were incubated with MV-free and MVs for 12 hours. B cells were harvested and evaluated for the acquisition of the CTV dye and PD-L1 by flow cytometry. (I) Flow cytometry analysis of PD-L1 expression by different immune cell populations in CT2A tumors (n= 4 mice). (J) PD-L1 detection in the MV membrane and lumen fractions versus MDSC membrane and cytosol fraction by Western blot. All histograms mean±SD of triplicates. In all experiments, ns: no statistically significant, *p<0.05, **p<0.01, ***p<0.001, ****p<0.0001.

