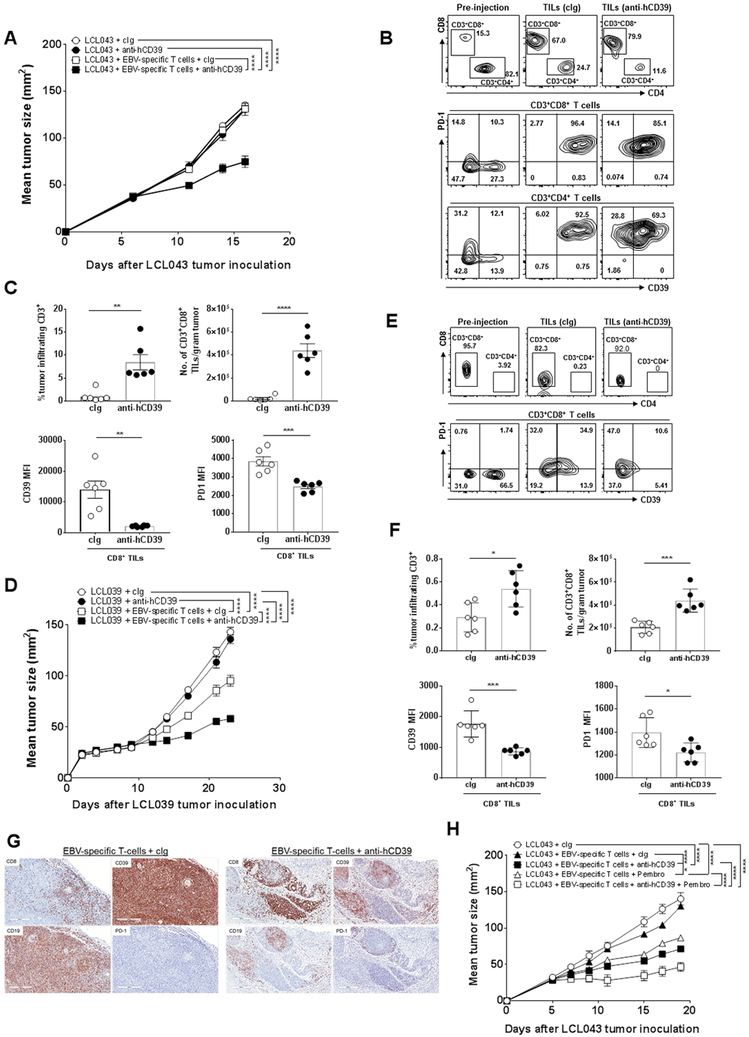
Figure 7. Anti-hCD39 mAb and EBV-specific T cells effectively control LCL tumor growth in NRG mice.
(A) Groups (n = 6/group) of NRG mice were injected s.c. with EBV-transformed lymphoblastoid cells LCL043 (1 × 10⁷) on day 0. In some groups EBV-specific T cells (9 × 10⁶) were administered i.v. on day 5 as indicated and all experimental groups were then treated i.p. with either human cIg (250 μg) or anti-hCD39 (250 μg) on days 5, 8, 11, and 14. Tumor sizes (mm2) were measured at the indicated time points and presented as mean ± SEM. This experiment is representative of two performed. Significant differences between the indicated groups were determined by a two-way ANOVA, followed by Tukey's multiple comparison test (**** P < 0.0001). (B-C). From (A), Tumors were collected, single cell suspensions were made and subjected to flow cytometry. (B) Representative FACS plots of pre-injection EBV-specific T cell cultures and tumors post cIg- or anti-CD39 (TTX-030) therapy (day 17 post tumor inoculation) and (C) summary bar graphs showing frequencies of tumor infiltrating CD3+ T cells, numbers of CD3+CD8+ T cells, and expression levels of CD39 and PD1 on CD8 T cells in LCL tumors post cIg- or anti-CD39 therapy. Significant differences were determined by Mann-Whitney U test (** P < 0.01, *** P < 0.001, **** P < 0.0001). (D) Groups (n= 6/group) of NRG mice were injected s.c. with donor-derived EBV-transformed lymphoblastoid cells LCL039 (1 × 10⁷) on day 0. In some groups EBV-specific T cells (9 × 10⁶) were administered i.v. on day 10 as indicated and all experimental groups were then treated i.p. with anti-hCD39 (250 μg) or human cIg (250 μg) on day 10, 13, 16, and 19. Tumor sizes (mm2) were measured at the indicated time points and presented as mean ± SEM. This experiment is representative of two performed. Significant differences between the indicated groups were determined by a two-way ANOVA, followed by Tukey's multiple comparison test (**** P < 0.0001). (E-F). From (D), tumors were collected, single cell suspensions were made and subjected to flow cytometry. (E) Representative FACS plots of pre-injection EBV-specific T cell cultures and tumors post cIg- or anti-human CD39 therapy (day 23 post tumor inoculation) and (F) summary bar graphs showing frequencies of tumor infiltrating CD3+ T cells, numbers of CD3+CD8+ T cells and expression levels of CD39 and PD1 on CD8 T cells in LCL tumors post cIg- or anti-CD39 therapy. Significant differences in percentages between the selected cell populations were determined by Mann-Whitney test (* P < 0.05, *** P < 0.001). (G) Representative immunohistochemical staining of CD8, CD39, PD1 and CD19 on day 23 (end point) LCL039 tumors showing increased CD8+ T cell infiltration and reduced CD39 expression in the EBV–specific T cell/anti-hCD39-treated tumors. (H) Anti-hCD39 and pembrolizumab combine with autologous EBV-specific T cells to suppress human B cell LCL043 lymphoma. Groups (n = 6/group) of NRG mice were injected s.c. with EBV transformed lymphoblastoid cells LCL043 (1 × 10⁷) on day 0. In some groups EBV-specific T cells (9 × 10⁶) were administered i.v. on day 5 as indicated and all experimental groups were then treated i.p. with human cIg (250 μg) or anti-hCD39 (250 μg) or pembrolizumab (anti-human PD1) (250 μg) or both (250 μg; 250 μg) on days 5, 8, 11, and 14. Tumor sizes (mm2) were measured at the indicated time points and presented as mean ± SEM. All experiments were performed once unless indicated. Significant differences between the indicated groups were determined by a two-way ANOVA, followed by Tukey's multiple comparison test (* P < 0.05, *** P < 0.001, **** P < 0.0001).

