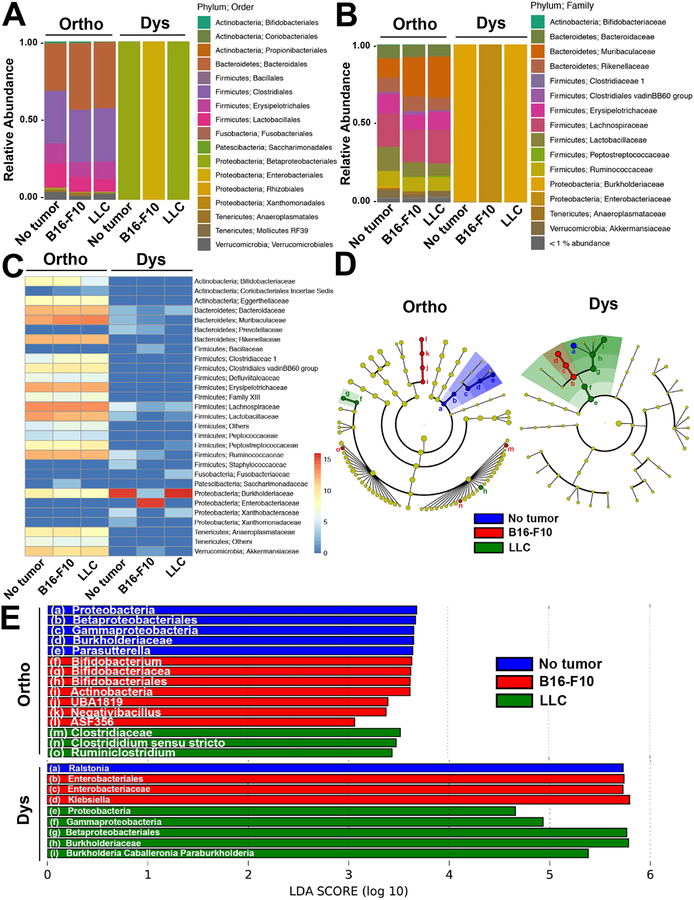
Figure 1. Microbial community composition in tumor free or mice bearing B16-F10 melanoma or LLC with or without dysbiosis.
Microbial composition in healthy controls (Ortho) and antibiotic exposed (Dys) mice with and without B16-F10 melanoma or LLC at the (A) Order and (B) Family levels. (C) Log2 abundance heatmap of microbial families. The relative abundance for the microbial families is indicated by hue. (D) Taxonomic cladograms obtained from LEfSe analysis of 16S rRNA sequences (blue = no tumor; red = B16-F10; green = LLC). Yellow circles represent non-significant differences in abundance between the groups. (E) LEfSe analysis revealing differentially enriched microbial groups across tumor types (blue = no tumor; red = B16-F10; green = LLC) within each of the Ortho and Dys groups. For A-C, independent samples (n = 4 each) were merged (i.e. ASV read counts summed) into their respective groups prior to visualization. The letters a-i in panel D refer to the microbial groups listed in panel E.

