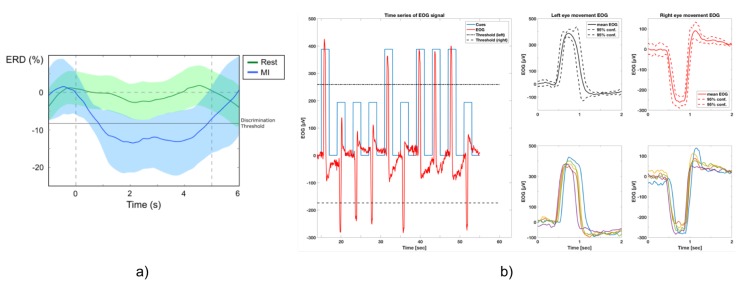
Figure 2.
(Example of ERD and EOG control signals. (a) Example of event-related desynchronization (ERD) of “rest” and “motor imagery” (MI) phase. During calibration, discrimination threshold for reliable differentiation is set. (b) Overview of EOG control signals. Left side: EOG time series of horizontal eye movements (red). Movements are cued to left (blue long bars) and right (blue short bars) movements. Black dotted lines represent 60% discrimination thresholds based on maximum EOG peaks. Right side: Time-locked EOG signals of left/right horizontal eye movements during cue presentations. Plots show mean EOG with 95% confidence intervals (upper figures), which is calculated out of the EOG raw signals (lower figures).

