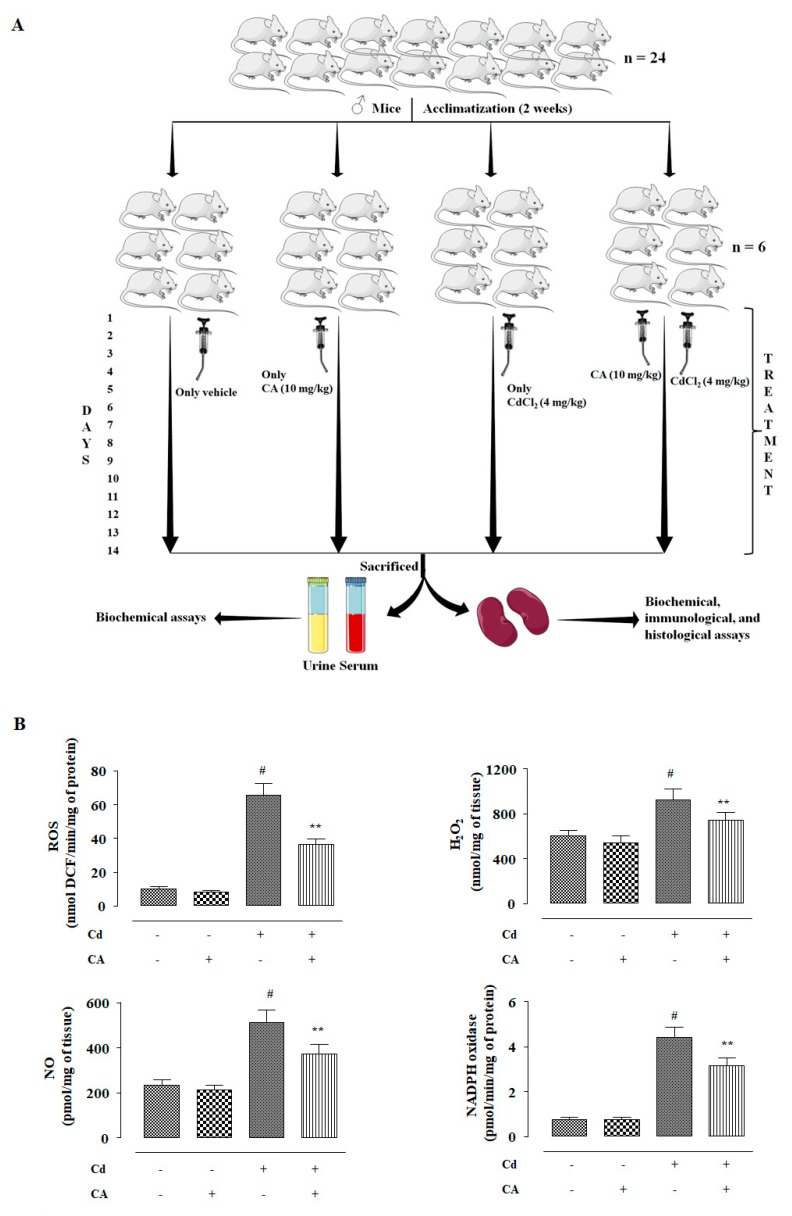
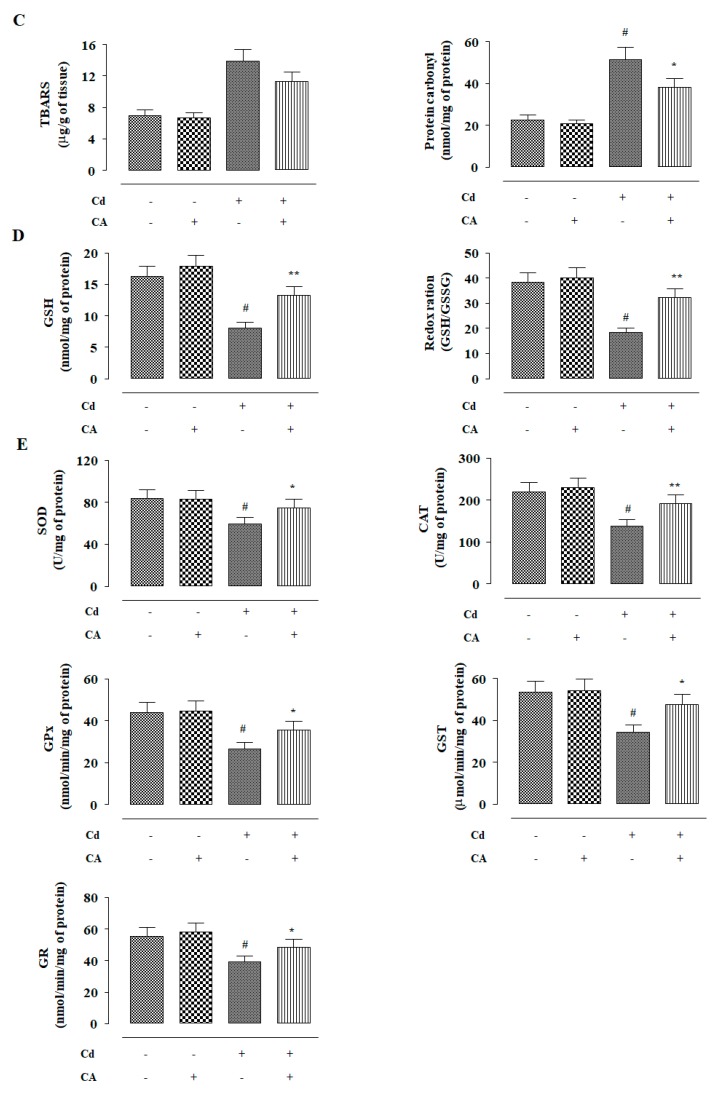
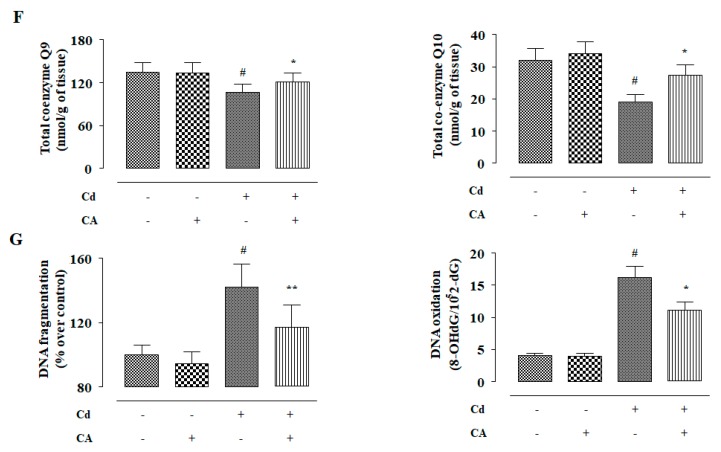
Figure 5.
The effects of CdCl2 and/or CA on the redox imbalance in vivo in mouse kidney. (A) Scheme for in vivo experiment. (B) The effect on ROS accumulation, NO production, H2O2 level, and NADPH oxidase activity. (C) The effects on lipid peroxidation and protein carbonylation. (D) The effects on GSH level and redox ratio. (E) The effects on endogenous antioxidant molecules. (F) The effect on total co-enzymes Qs. (G) The effects on DNA oxidation and DNA fragmentation. Data are represented as the mean ± SD, n = 6. # Values significantly (p < 0.01) differed from the vehicle-treated group. * Values significantly (p < 0.05) differed from only the CdCl2-treated group. ** Values significantly (p < 0.01) differed from only the CdCl2-treated group. SOD unit, “U”, is defined as inhibition (μ-moles) of NBT-reduction/min. CAT unit, “U”, is defined as H2O2 consumption/min.


