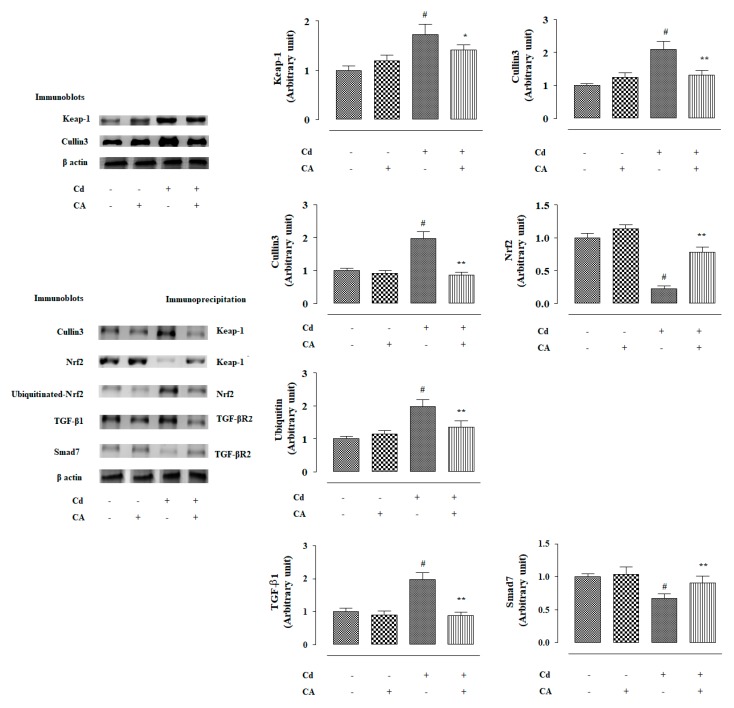
Figure 7.
The effects of CdCl2 and/or CA on co-immunoprecipitation assays in mouse kidneys in vivo. The relative band intensities were measured and the intensity of the normal control band was chosen as 1. β-actin served as loading control. Data are represented as mean ± SD, n = 6. # Values significantly (p < 0.01) differed from the vehicle-treated group. * Values significantly (p < 0.05) differed from only the CdCl2-treated group. ** Values significantly (p < 0.01) differed from only the CdCl2-treated group.

