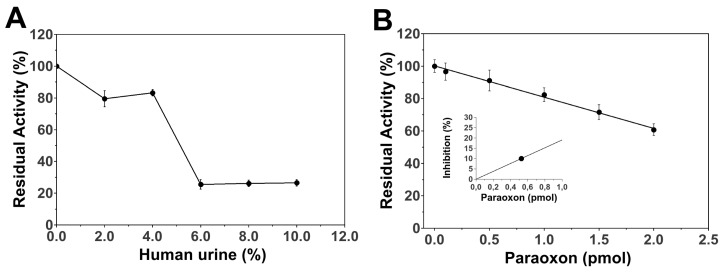
Figure 4.
Determination of paraoxon in human urine. (A) Plot of EST2 residual activity in presence of increased amount of urine. (B) Plot of EST2 residual activity in 4% urine, in the presence of the increasing concentration of paraoxon. In the insert, the percentage of inhibition of EST2 in the presence of this increasing concentration of paraoxon. The error bars represent the SD from three independent experiments.

