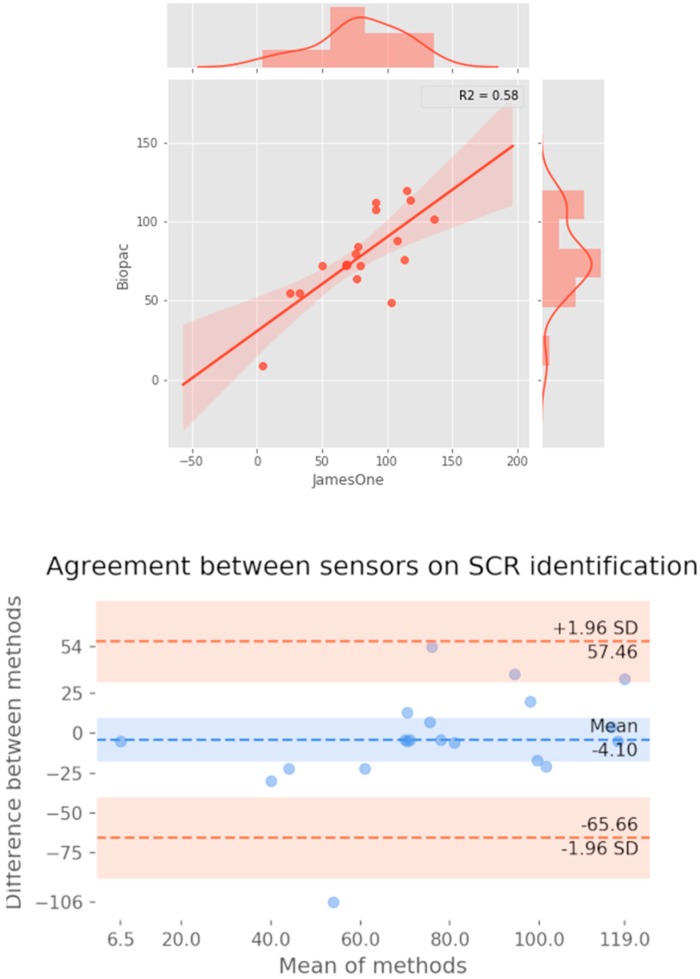
Figure 11.
Association between the number of skin conductance responses identified at the threshold of 0.01 microsiemens between systems. Top: Scatter plot representing the magnitude of association; on the right and top ends of the plot, the histogram of the distribution of SCRs for each sensor is displayed. Bottom: Bland-Altman plot displaying the agreement between systems.

