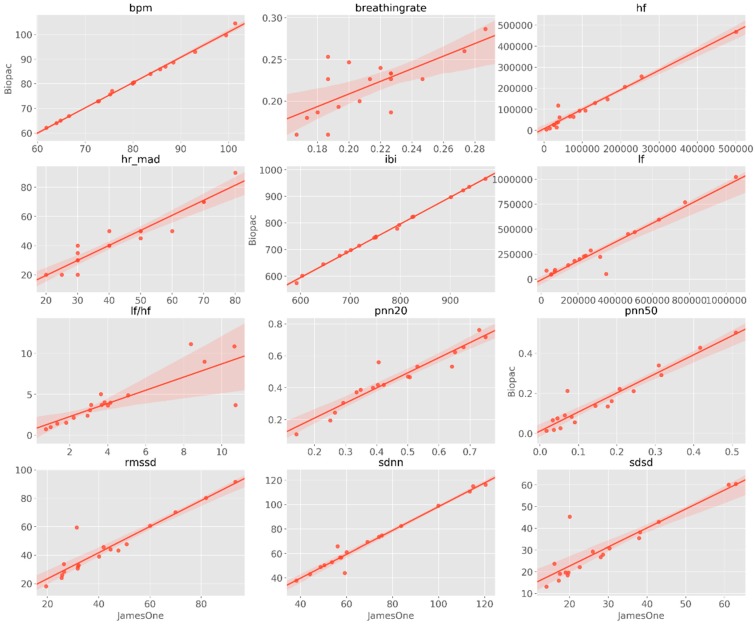
Figure 14.
Scatter plots representing the magnitude of association across different metrics derived from the PPG signal. BPM—beats per minute, IBI—inter-beat interval, SDNN—standard deviation of RR intervals, SDSD—standard deviation of successive difference, RMSSD—root mean square of successive differences, pNN20—proportion of successive differences above 20 ms, pNN50—proportion of successive differences above 50 ms, MAD—median absolute deviation of RR intervals, LF-HRV—low-frequency HRV (range: 0.05–0.15 Hz), HF-HRV—high-frequency HRV (range: 0.15–0.5 Hz), HF/LF HRV—ratio between high-frequency and low-frequency HRV.

