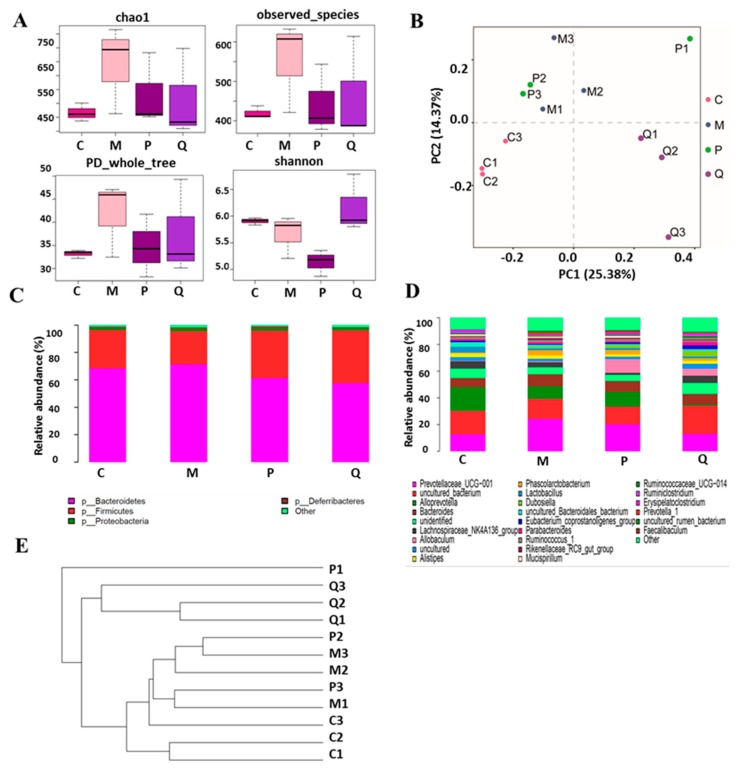
Figure 6.
IN treatment changed the structure of gut microbiota in DSS model mice. (A) Alpha diversity index estimated the richness and diversity of colon contents and bacterial populations. (B) Multiple sample principal component analysis (PCA). (C) Relative abundance of the main phylum in the intestinal microbiota. (D) Relative abundance of the main genus in the intestinal microbiota. (E) System clustering tree of gut microbiota based on unweighted Unifrac metrics indicating the beta diversity of gut microbiota in each group. Note: C = control group; M = DSS model group; P = SASP group at 125 mg/kg; Q = IN group at 200 mg/kg. Here, n = 3 for each group.

