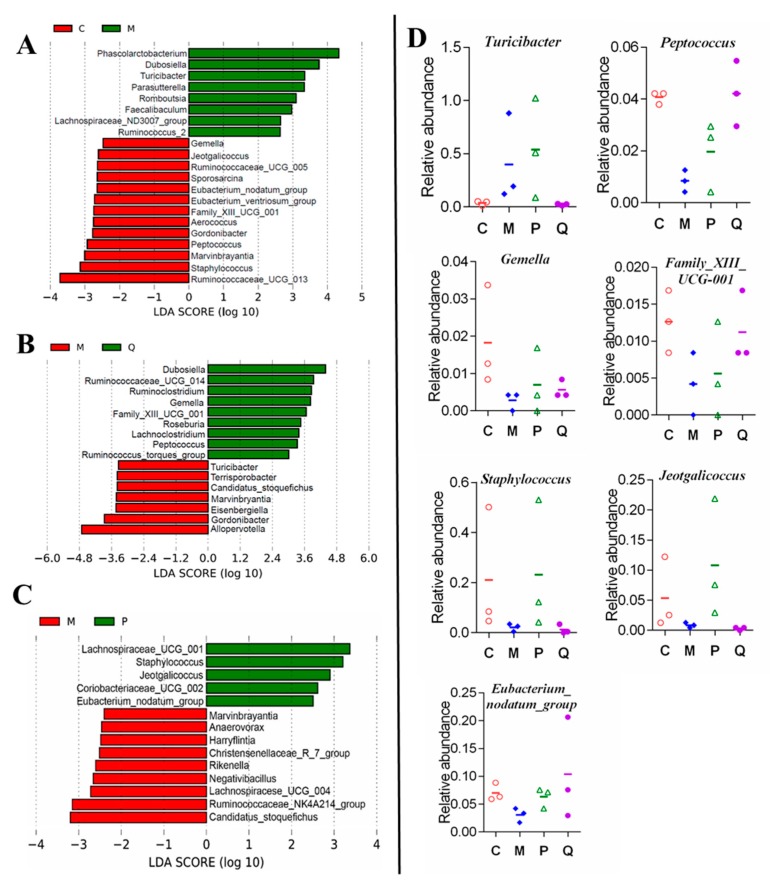
Figure 7.
Difference in dominant microorganisms between groups in LDA effect size (LefSe) analysis based on genus abundance (n = 3), showing the genera with LDA scores of more than 2 and a significant value less than 0.01. (A) Control and model groups. (B) Model and IN groups. (C) Model and positive groups. (D) Abundance of genera that is significantly changed by IN and SASP treatment. The percentages were calculated from the number of sequenced tags for each genus out of the total tags. Note: C = control group; M = DSS model group; P = SASP group; Q = IN group.

