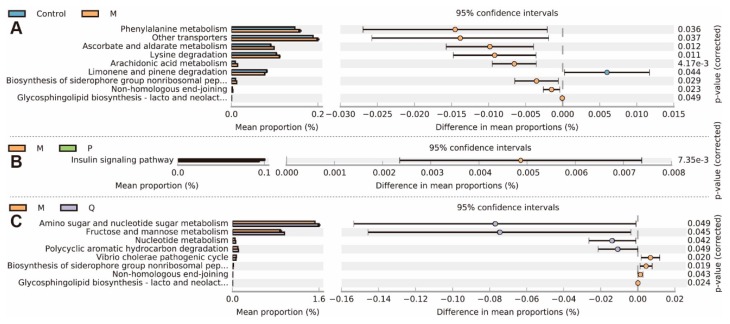
Figure 8.
The changes in the metabolic genes in the metagenomes induced by different treatments. (A) Control and model (M) groups. (B) Model (M) and positive (P) groups. (C) Model (M) and IN (Q) groups. Extended error bar plot of genes (categorized by level 3 KEGG pathways) was made using STAMP software, while significant values between groups were calculated by Wilcoxon test, with 0.01 set as the significance threshold (n = 3).

