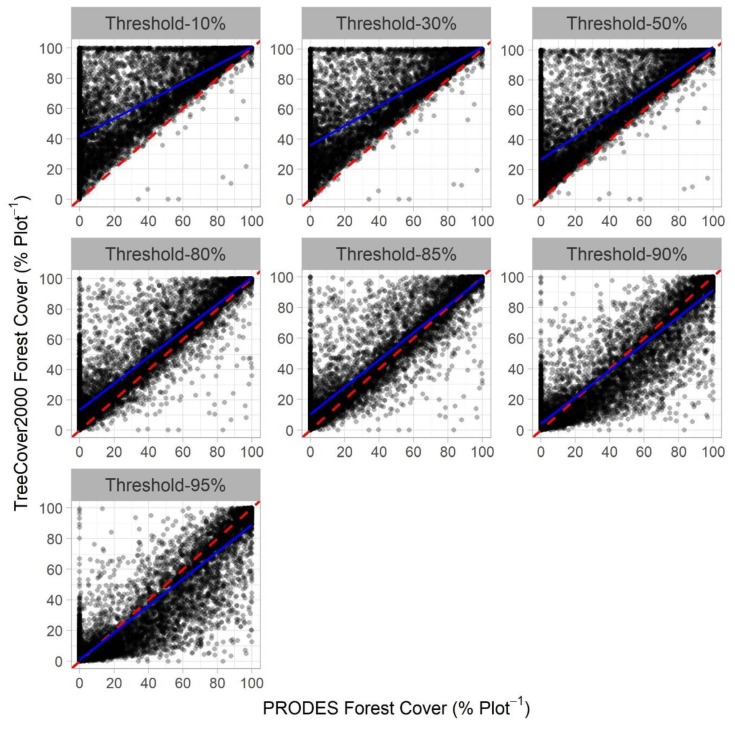
Figure 4.
Regression between the forest percentage within all of 9329 (10 by 10 km) samples cells using different thresholds from the Tree Canopy Cover 2000 data and their corresponding percentages on a reference map developed using the PRODES data. The dashed red line is the 1:1 line. The blue line is the average regression line from 10,000 interactions for each threshold tested.

