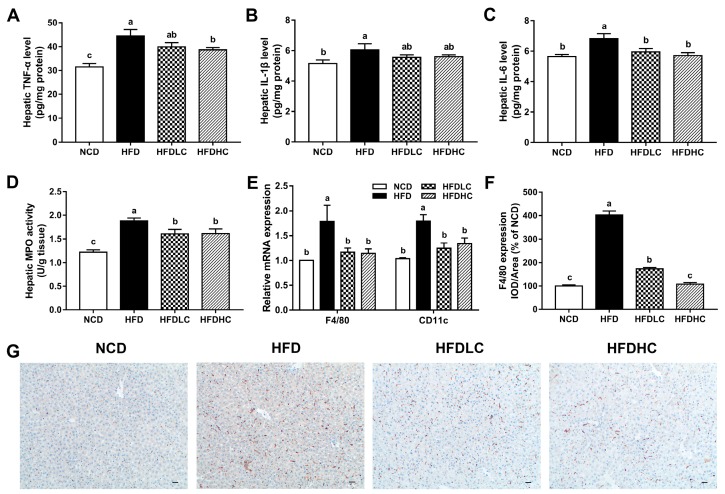
Figure 3.
Effects of COS on hepatic inflammation in mice: (A) hepatic TNF-α level; (B) hepatic IL-1β level; (C) hepatic IL-6 level; (D) hepatic MPO activity; (E) relative mRNA expression of F4/80 and CD11c; (F) the IOD/area ratio of F4/80; (G) immunohistochemical staining of F4/80 in the liver (scale bar, 30 μm). Data are presented as the mean ± SE (n = 6 per group). Results were statistically analyzed using one-way ANOVA followed by Duncan’s multiple-comparison test, and values with different labels (a–c) are significantly different (p < 0.05). NCD, normal chow diet group; HFD, high-fat diet group; HFDLC, high-fat diet + low dosage of COS (200 mg/kg BW) group; HFDHC, high-fat diet + high dosage of COS (400 mg/kg BW) group. TNF-α, tumor necrosis factor-α; IL-1β, interleukin-1β; IL-6, interleukin-6; MPO, myeloperoxidase; IOD, integrated optical density.

