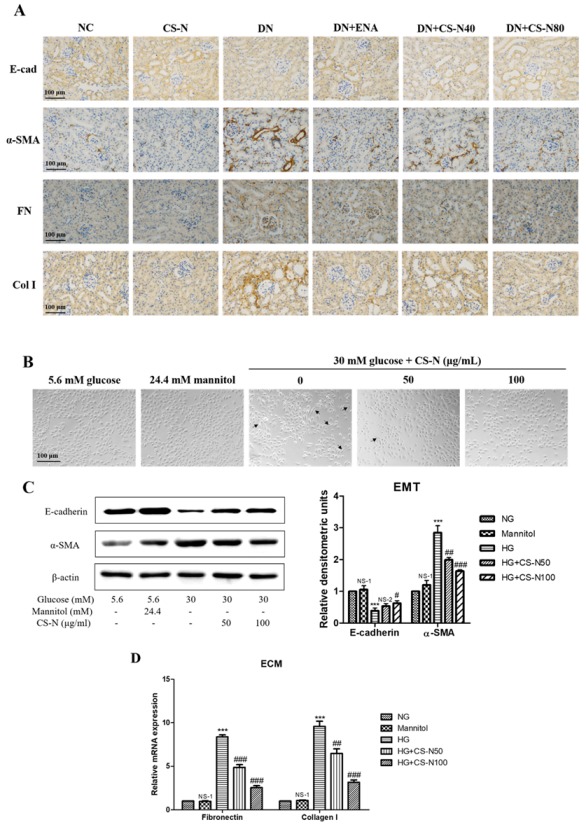
Figure 4.

CS-N reversed epithelial-mesenchymal transition (EMT) and extracellular matrix (ECM) accumulation in STZ-induced diabetic mice and high glucose-induced HK-2 cells. (A) Representative renal sections with immunohistochemical staining of E-cadherin (E-cad), α-smooth muscle actin (α-SMA), fibronectin (FN), and collagen I (Col I). (B) Morphological changes of HK-2 cells cultured under different conditions. (C) Expressions of E-cadherin and α-SMA in HK-2 cells cultured under different conditions through western blotting. (D) Expressions of fibronectin and collagen I mRNA in HK-2 cells cultured under different conditions through RT-PCR. Data are presented as the means ± SDs, triplicate. NC: normal control; DN: diabetic nephropathy model induced by streptozotocin (STZ); ENA: positive control, 1.5 mg/kg/day enalaprilat administration; CS-N40, CS-N80: 40, 80 mg/kg/day CS-N administration. NG: 5.6 mM glucose; Mannitol: 5.6 mM glucose + 24.4 mM mannitol; HG: 30 mM glucose. NS-1 p > 0.05; ** p < 0.01, *** p < 0.001 compared with the NG group; NS-2 p > 0.05; # p < 0.05; ## p < 0.01; ### p < 0.001 compared with the HG group.
