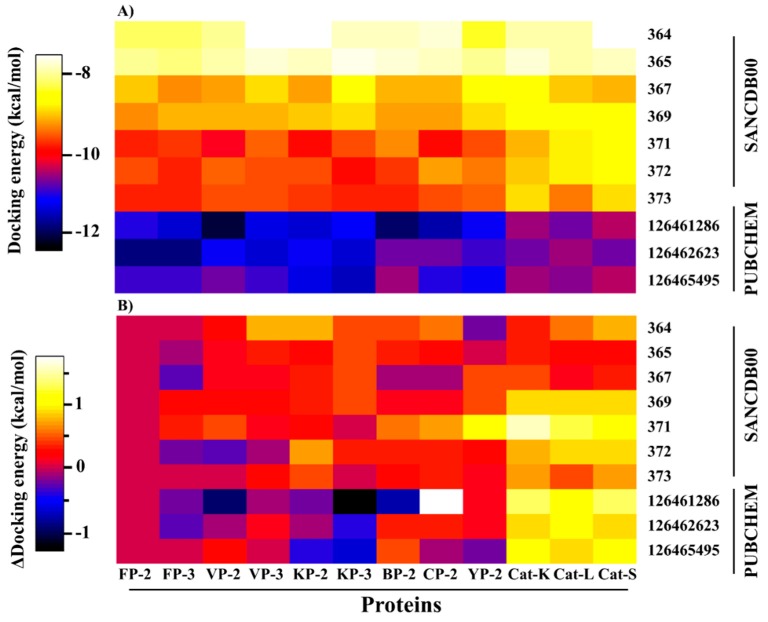
Figure 4.
A heatmap representation of (A) interaction energies between the selected hits and the plasmodial proteases as well as human cathepsins and (B) interaction energy difference of the various complexes to the corresponding FP-2-hit complex. Weak interactions are shown in white while in black are complexes with the strongest affinities.

