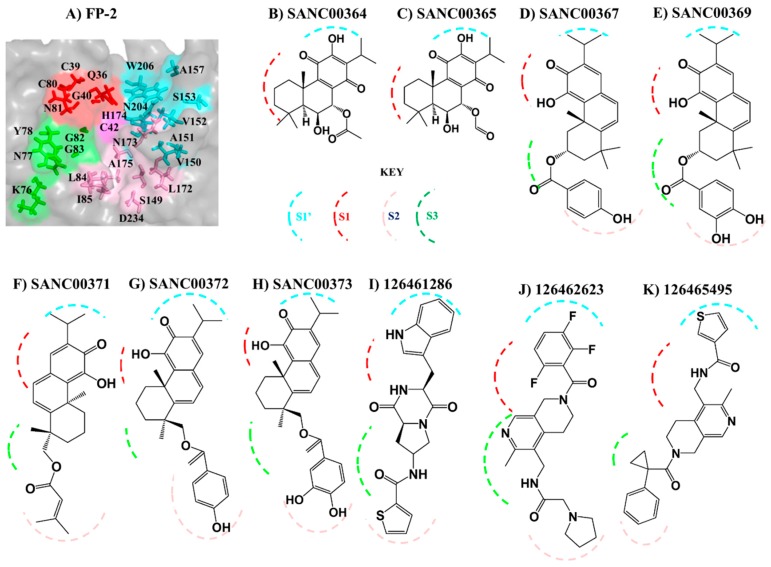
Figure 5.
Ligand binding mode in plasmodial proteases. (A) A zoomed surface representation of the FP-2 active site. Shown in sticks are the different subsite residues (S1 = Q36, C39, G40, C80, N81; S2 = L84, I85, S149, L172, N173, A175, D234; S3 K76, N77, Y78, G82, G83; S1′ = V150, A151, A157, H174, N204, W206). (B–K) Schematic representation of the interactions of the different compounds with the four subsites in the plasmodial proteins. S1 = Red, S2 = Pink, S3 = Green and S1′ = Pink broken lines.

