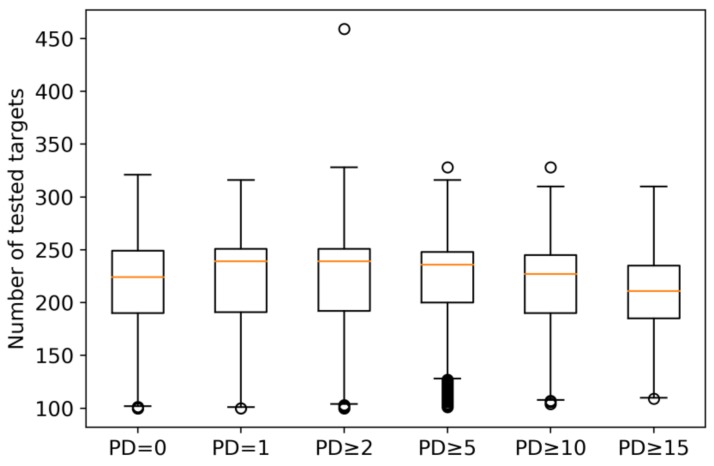
Figure 1.
Boxplots report the distribution of assayed targets for compounds with different promiscuity degrees. PD = 0 and PD = 1 denote compounds that were consistently inactive in all assays and active against a single target, respectively. Boxplots show the smallest value (bottom line), first quartile (lower boundary of the box), median value (red line), third quartile (upper boundary of the box), largest value (top line), and outliers (points below the smallest or above the largest value).

