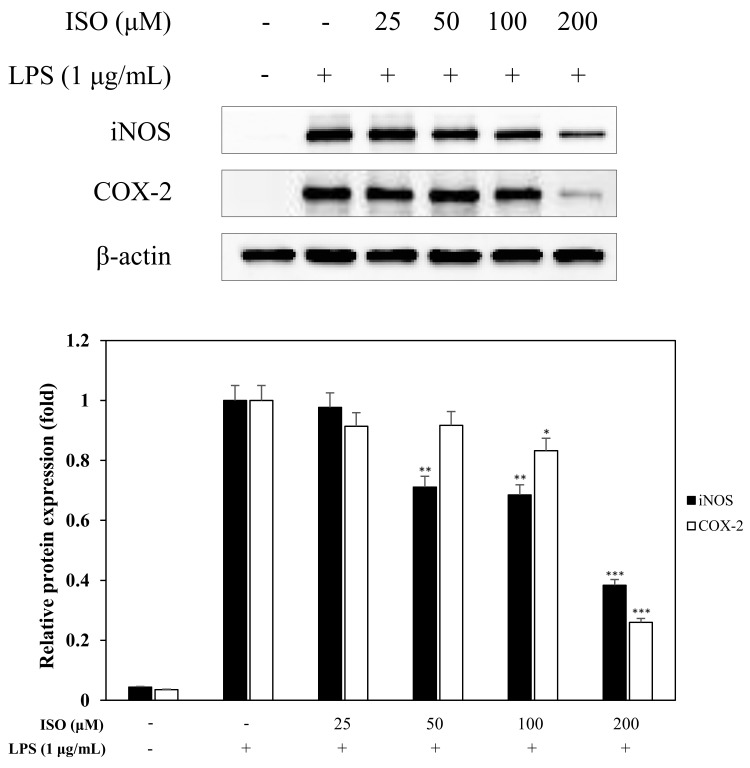
Figure 8.
Effects of isogosferol (ISO) on iNOS and cyclooxygenase-2 (COX-2) expression. RAW 264.7 cells were incubated in the presence of ISO (25, 50, 100, and 200 µM) for 1 h and stimulated with LPS (1 µg/mL) for 16 h. The levels of iNOS, COX-2, and β-actin in the LPS-stimulated cells were analyzed by western blot analysis. Relative density was calculated as the ratio of each protein level compared to β-actin. The data are expressed as the mean ± SD (n = 3) of three individual experiments, and * p < 0.05, ** p < 0.01, and *** p < 0.001, compared with LPS-treated controls.

