Figure 5.
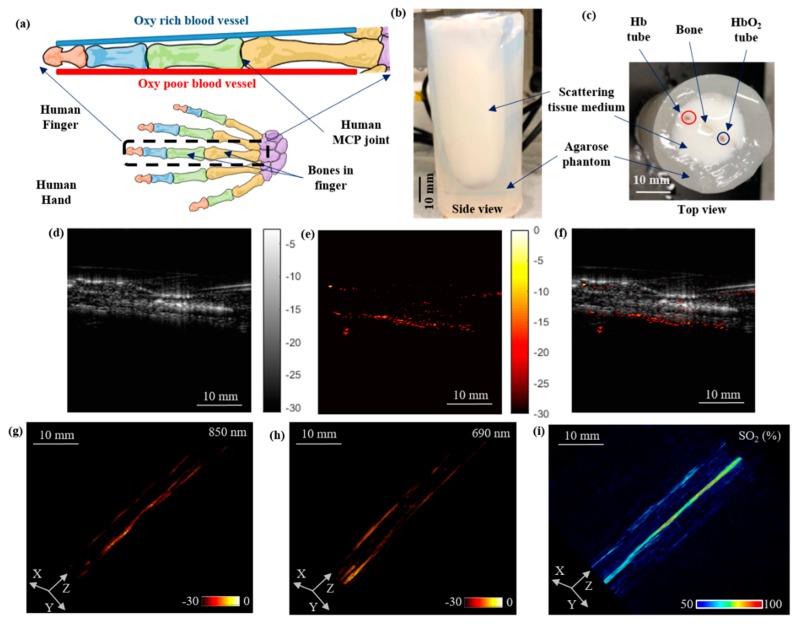
LED–PACT-imaging of vascular oxygen saturation using a human-finger-mimicking phantom. (a) Schematic sketch of a typical human finger with the location of bones and the blood vessels (oxy rich: HbO2; oxy poor: Hb). (b,c) The side and the top view photographs of the finger phantom consisting of bone and blood vessels. (d) The ultrasound (US), (e) photoacoustic (PA), and (f) co-registered PA–US frames acquired at one of the rotational steps during the 360 degree rotation around the phantom. (g,h) The reconstructed 3-D volume-rendered PACT images of the finger phantom using 850 nm and 690 nm LED illuminations, respectively. (i) The spectrally unmixed volumetric oxygen saturation map for the finger phantom.

