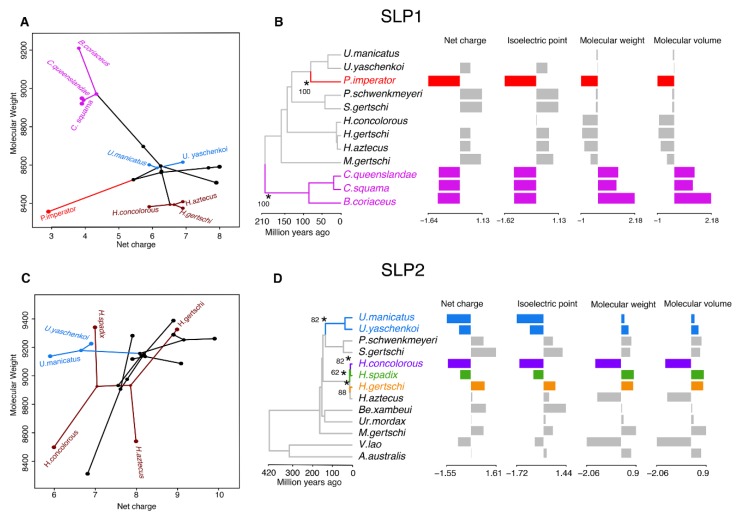
Figure 5.
Evolutionary analyses of the chemical properties of SLP homologs. (A) Visualization of the phylogenomic tree on the morphospace of the molecular weight and net charge of SLP1 (A) and SLP2 (C). Hadrurids, urodacids, and Cercophonius are colored accordingly to phylogenomic topology. (B–D) Two (SLP1) and four (SLP2) evolutionary shifts in the optimum chemical properties of SLPs under an Ornstein–Uhlenbeck (OU) process. Edges with a major shift are annotated with asterisk and bootstrap support values.

