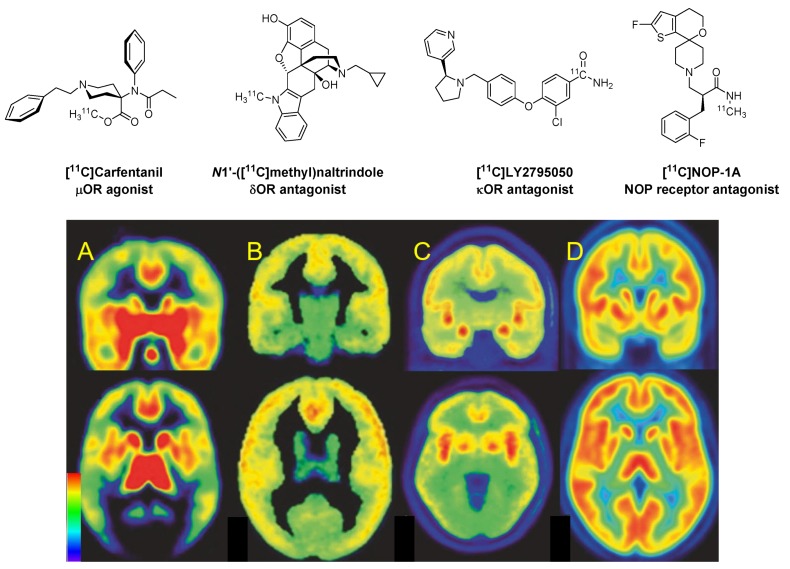
Figure 2.
Human brain opioid receptor PET images in coronal (upper row) and axial (lower row) planes. Modified and reproduced with permission from Peciña et al. [19]. From left to right, we see (A) the µOR agonist [11C]carfentanil, binding most abundantly in the caudate nucleus, anterior cingulate cortex, thalamus, and pituitary gland; (B) the δOR antagonist N1′-([11C]methyl)natrindole, which has diffuse binding throughout neocortex; (C) the κOR antagonist [11C]LY2795050, which has high binding in the insular cortex, lateral frontal cortex and amygdala; (D) the NOP antagonist [11C]NOP-1A, which binds abundantly throughout the brain. Binding sites of µ-, κ- and NOP-OR ligands are expressed as binding potential relative to the cerebellum (BPND), whereas binding of the δ-ligand (which has no non-binding reference region) is expressed as net influx (Ki,) in units of perfusion (mL cm−3 min−1). The color scale in the lower right indicates (for A, C, and D) BPND ranging from 0 to 2, or (B) Ki ranging from 0–0.1 mL cm−3 min−1

