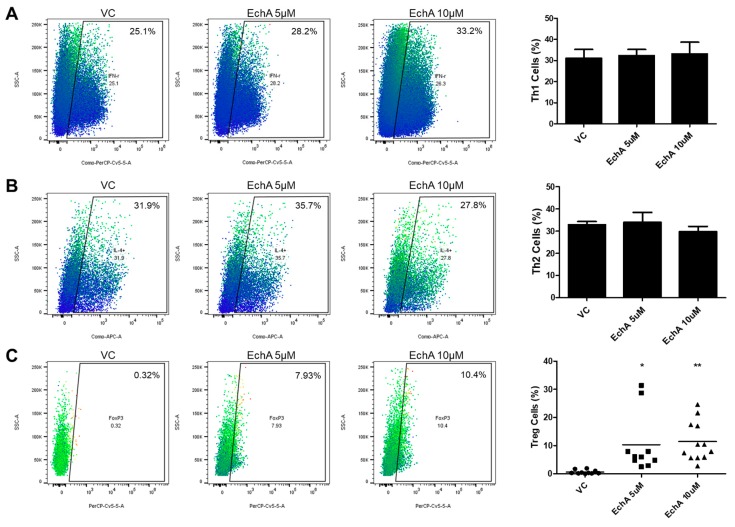
Figure 3.
Ech A impact on Th cell polarization in vitro. (A,B) the percentages of IFN-γ + and IL-4+ cells among CD4+ Th cells were evaluated using flow cytometry to determine the induction ratio of Th1 and Th2 cells, respectively. No significant change was observed upon Ech A treatment. (C) Spontaneous generation of Foxp3+ Treg cells among CD4+ Th cells upon vehicle and Ech A treatment was assessed using flow cytometry. Ech A treatment led to an increase in Treg population compared to the vehicle-treated group. VC, vehicle-treated control. * P < 0.05, ** P < 0.001. Results are shown as mean ± SD.

