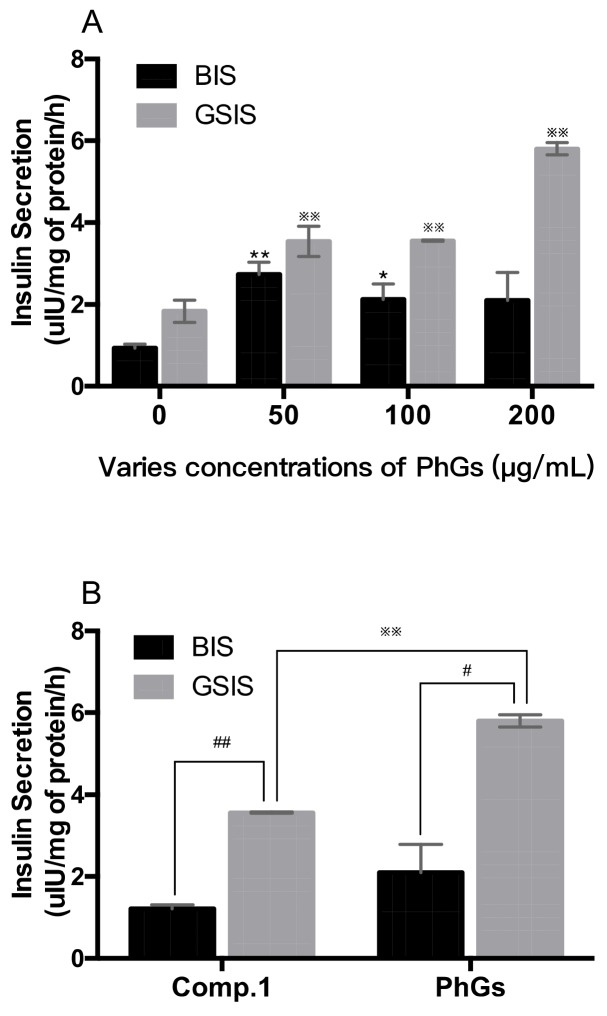
Figure 4.
Effect of compound 1 and PhGs on glucose-stimulated insulin secretion from INS-1 cells. (A) Various concentrations of PhGs were described; the black columns show the BIS groups, the grey columns show the GSIS groups; (B) A 200 µg/mL dose between PhGs and compound 1 was portrayed. * p < 0.05, ** p < 0.01 compared with cells incubated with 2.8 mM glucose only (BIS groups); ※※ p < 0.01 compared with cells incubated with 16.7 mM glucose only (GSIS groups); # p < 0.05, ## p < 0.01 compared with cells between BIS groups and GSIS groups.

