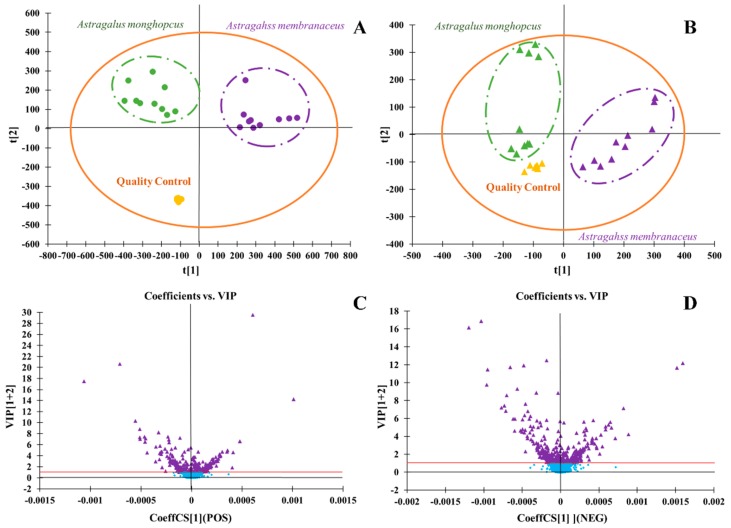
Figure 3.
The analysis of MG and MJ samples by UHPLC-ESI-Q-TOF-MS/MS. (A)-The principal component analysis (PCA) scores plots in positive ion mode; (B)-the PCA scores plots in negative ion mode; (C)-the variable importance in the projection (VIP) plot of the ions whose value ≥1 in positive ion mode; (D)-the VIP plot of the ions whose value ≥1 in negative ion mode.

