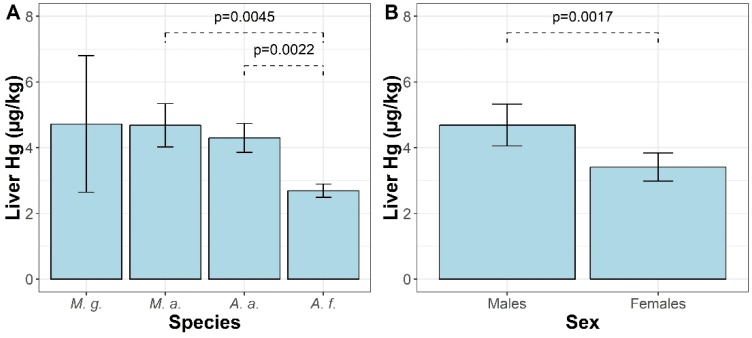
Figure 2.
(A) Differences in Hg concentrations in the liver between species (M. g—Myodes glareolus; M. a.—Microtus arvalis; A. a.—Apodemus agrarius; A. f.—Apodemus flavicollis). Results (in µg/kg of wet weight) were averaged by study site and sex. (B) Differences in Hg concentrations in the liver between males and females (in µg/kg of wet weight). Results were averaged by study site and species. Both bar and whisker plots show estimated marginal means and standard errors that were back-transformed from the log scale. Differences between marginal means were verified on the log scale.

