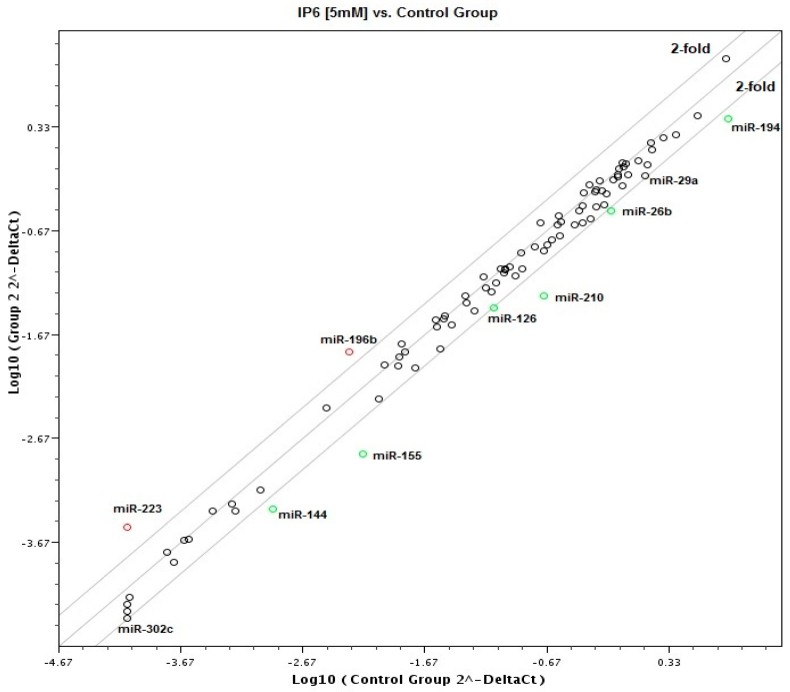
Figure 3.
Scatter plots of miRNAs expression in untreated cells versus Caco-2 cells treated with 5 mM IP6 (x-axis represents the 2−ΔCt value of control cells, and y-axis represents the 2−ΔCt value of IP6-treated cells). The expression value of each human miRNA was plotted as a scatter plot, and threshold lines were drawn at a 2-fold expression change.

