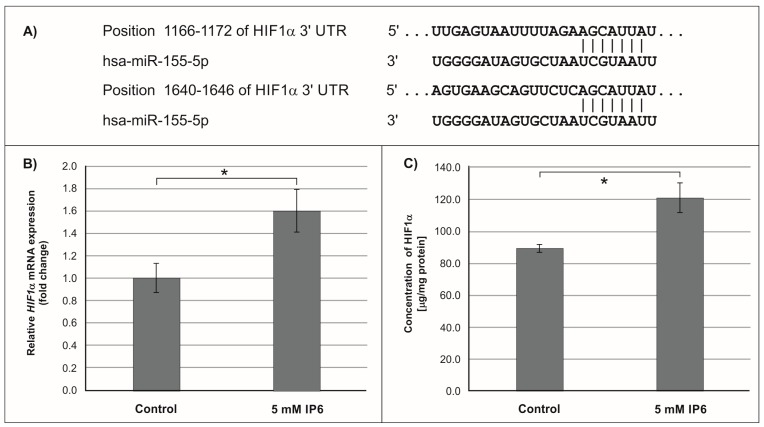
Figure 5.
Effect of 5 mM IP6 on HIF-1α gene expression in Caco-2 cells at 24 h. (A) Schematic of the putative binding sites of miR-155-5p in 3′-UTR of HIF-1α miRNA, as determined by bioinformatics analysis. (B) Changes in HIF-1α mRNA expression in Caco-2 cells, as determined by RT-qPCR. (C) Changes in HIF-1α protein concentration in Caco-2 cells, as determined by ELISA test. The results are presented as mean ± SD of three separate experiments; * p < 0.05 versus control.

