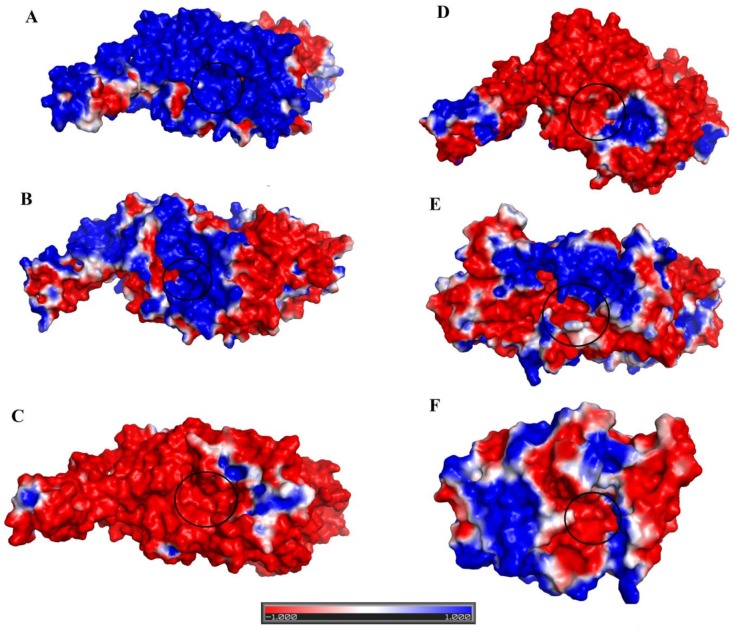
Figure 7.
Surface charge distributions of (A) PDE_Ca, (B) PDE_Vl, (C) human Ectonucleotide pyrophosphatase/phosphodiesterase 3 (ENPP3), (D) Ectonucleotide pyrophosphatase- phosphodiesterase-1 (NPP1) (Mus musculus), (E) ENPP2 (human Autotaxin), and (F) Xac Nucleotide Pyrophosphatase/Phosphodiesterase (Xanthomonas axonopodis). Blue, red, and white represent the positive, negative, and neutral regions, respectively. Black circles indicate the location of the active-site pocket.

