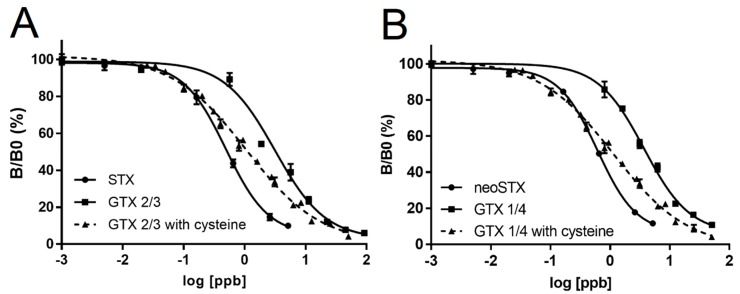
Figure 4.
ELISA analysis of the L-cysteine conversion experiments. GTX 1/4 or GTX 2/3 were exposed to an excess of L-cysteine for the conversion to neoSTX or STX, respectively (n = 3). (A) shows the standard curve results of STX and GTX 2/3 untreated and after L-cysteine treatment, whereas (B) shows the standard curve results of neoSTX and GTX 1/4 untreated and after L-cysteine treatment.

