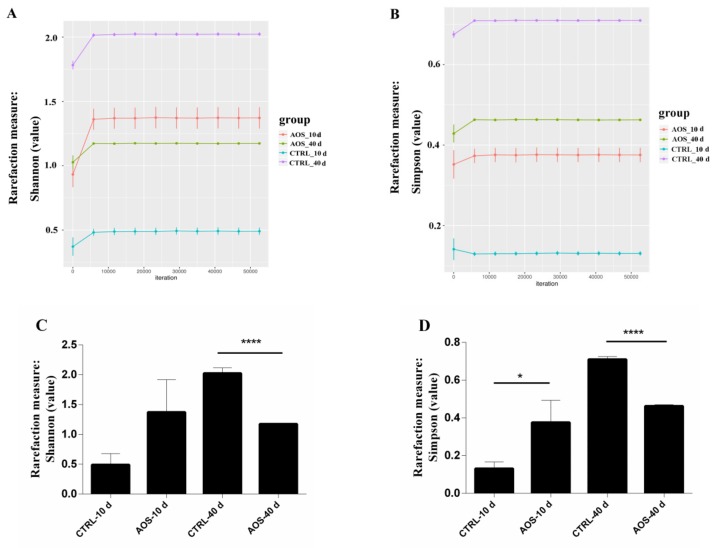
Figure 5.
Abundance index of the microbial community in the midgut of the AOS-fed and control groups. The abundance index was measured on different days. The dilution curves include the Shannon index (A) and the Simpson index (B), and contrast histograms of the dilution index include the Shannon index (C) and the Simpson index (D) of the alpha diversity of sample species abundance. The results are expressed as the means ± SEMs (n = 3). Each group included three biological replicates; * p < 0.05 and **** p < 0.0001 represent significant differences.

