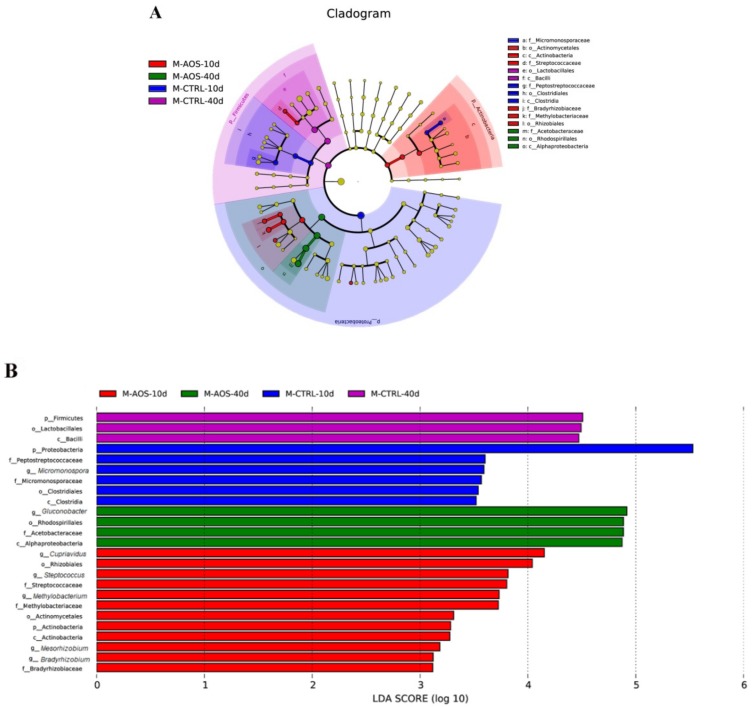
Figure 6.
Cladograms of bacterial lineages showing significant differences between the AOS-fed and control groups. The cladogram in (A) shows the relative abundance of dominant bacteria in the Drosophila intestine that met a significant LDA threshold value of >2 in the AOS-fed and control groups. The bacterial community from the phylum to the genus level is provided from the center to the outside, respectively. Different colors represent different groups and the yellow node represents a group of microbes that do not play important roles in the different groups. An LEfSe analysis of the 16S sequence was used to obtain a taxonomic cladogram and estimate the effective proportional abundance of each component. The lengths represent the effect size of the bacterial lineages (B).

