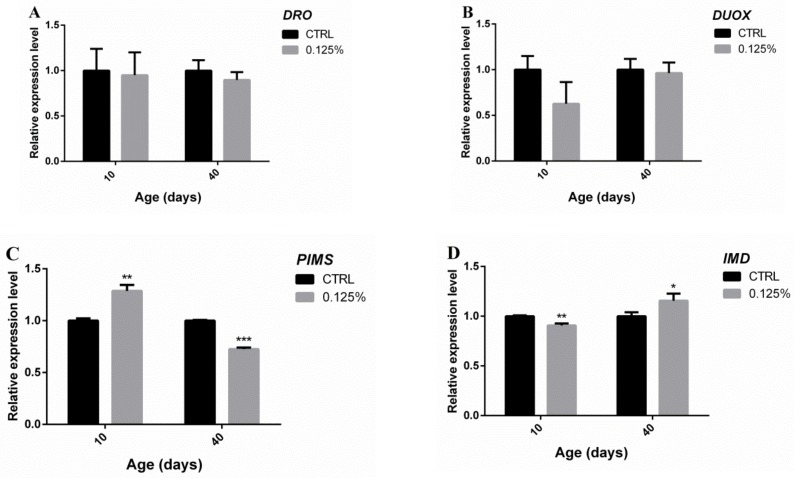
Figure 8.
Fluorescence quantitative PCR detection of the expression of DRO (A), DUOX (B), PIMS (C), and IMD (D) in the flies in the experimental and control groups on the 10th and 40th days. The results are presented as the means ± SEMs (n = 3). Each group included three biological replicates; * p < 0.05 and ** p < 0.01 indicate significant differences.

