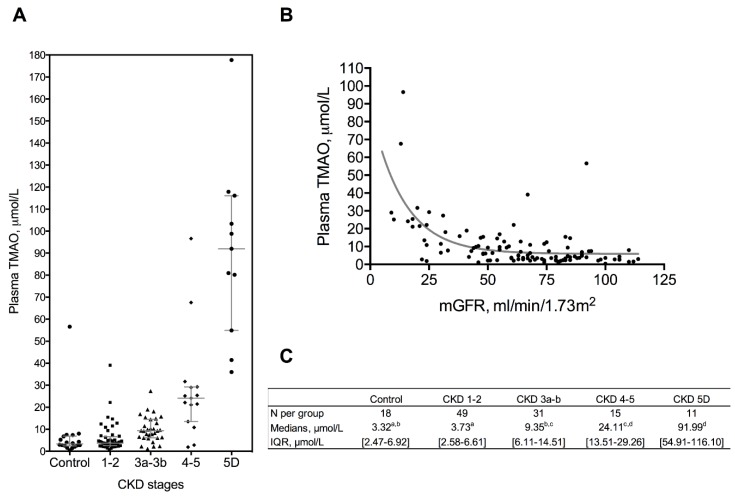
Figure 1.
Plasma TMAO levels according to CKD stages. (A–C): plasma TMAO is increased in chronic kidney disease. Data for plasma TMAO are shown according to CKD stages and are expressed as medians [interquartile range]. Groups were compared with a Kruskal–Wallis test. Different letters indicate significant differences (p < 0.05) between groups. (B) Plasma TMAO concentrations is negatively correlated with mGFR measured by gold standard method (r2 = 0.388).

