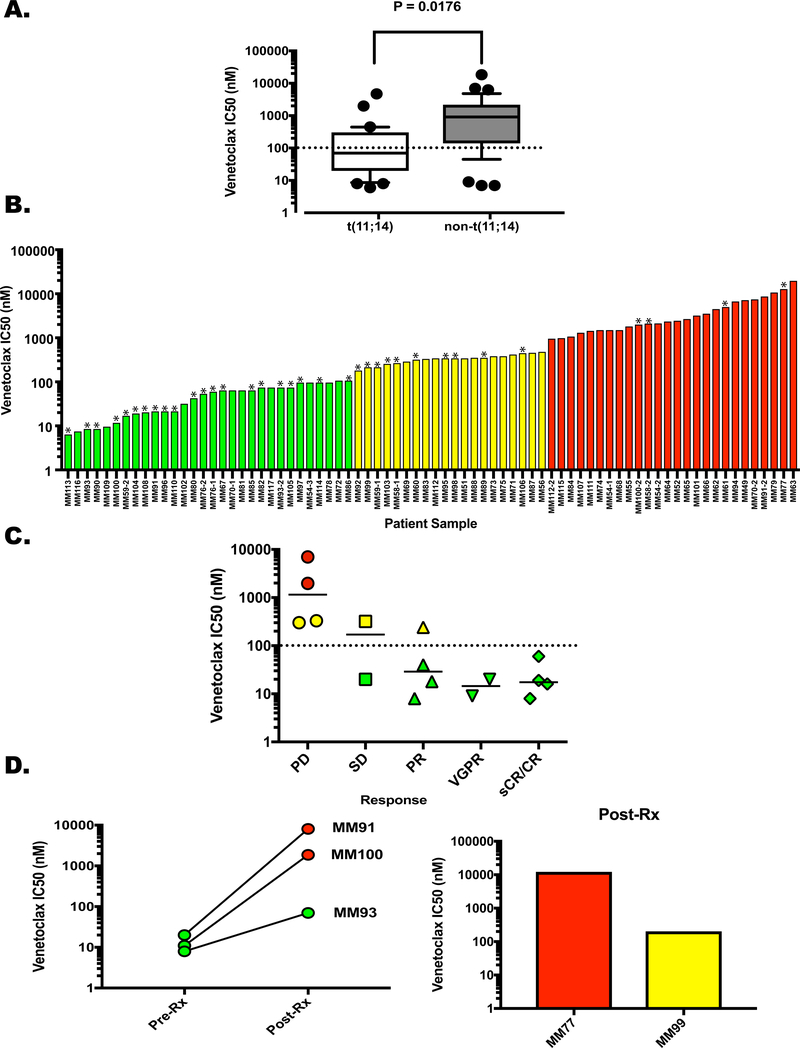
Figure 1. Ex Vivo Response of Patient-Derived Plasma Cells to Venetoclax.
Buffy coat cells were treated with Venetoclax for 24 h and apoptosis of the plasma cells was determined as described in the Supplemental Methods section. Dose curves using concentrations of 0, 10, 100 and 1000 nM venetoclax were used to calculate the IC50 for each patient sample. A. The samples were clustered based on the presence (N=31) or absence (N=36) of the t(11;14) translocation and graphed according to IC50. Whiskers extend from 10–90%, P=0.0176. Post-venetoclax treatment samples were removed from this analysis due to the effects of acquired resistance. B. Samples separated into 3 categories according to venetoclax sensitivity; Green – highly sensitive, IC50 up to 100 nM, Yellow – intermediate sensitivity, IC50 170 nM – 450 nM, Red – resistant, IC50 ≥ 900 nM. Asterisks denote samples from t(11;14)-positive patients C. Clinical response of 16 patients graphed versus IC50. Progressive disease (PD) N = 4, Single agent venetoclax; stable disease (SD) N = 2, single agent venetoclax. Partial response (PR) N = 4, venetoclax monotherapy; very good partial response (VGPR) N = 2, 1 single agent venetoclax, 1 venetoclax plus daratumamab and dexamethasone; stringent complete response sCR N = 4, 2 venetoclax monotherapy, 2 venetoclax plus dexamethasone. Dotted line represents the cutoff for the most sensitive cohort (100 nM), solid lines represent the median IC50 for each response. Symbol colors represent sensitivity as shown in Figure 1B. D. (Left) Ven IC50 for MM91, MM100, and MM93 before treatment and upon progression. (Right) Post-Ven IC50 for MM77 and MM99. Pre-treatment samples were not obtained.

