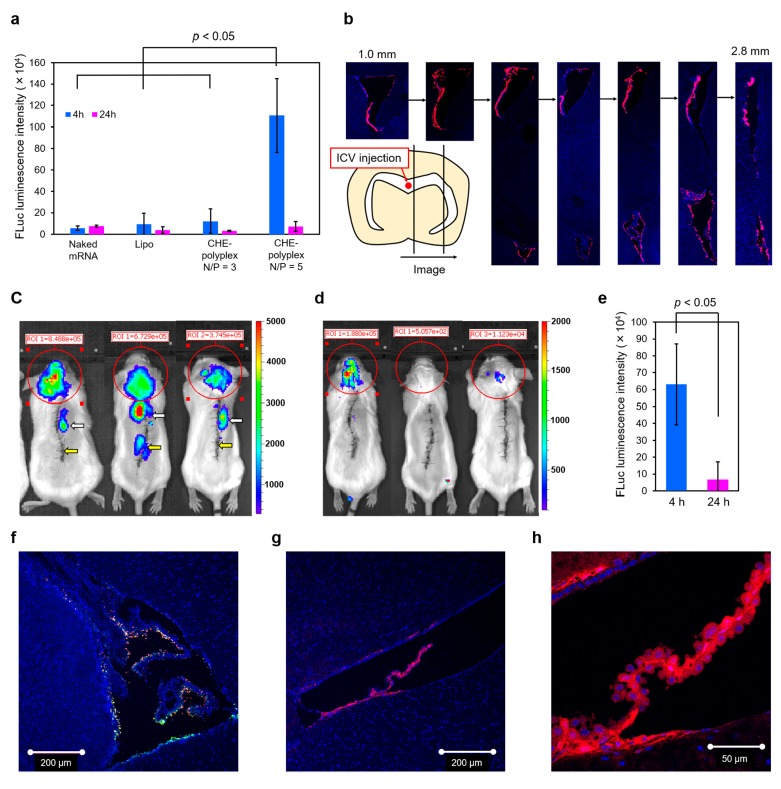
Figure 4.
(A) Quantitative evaluation of FLuc-mRNA expression level after intracerebroventricular administration into mice. Polyplexes (DP = 26) and Lipo were administered at 4.5 μg FLuc-mRNA, and the luminescence intensities in the brain were measured by an IVIS instrument 4 and 24 h after injection. Naked mRNA was also administered as a control. Results are expressed as mean ± SD (n = 3). (B) Histological evaluation of the brain treated with CHE-polyplex (DP = 26, N/P = 5) loaded with Cy5-mRNA 4 h after injection. The brain was serially sectioned from the center to the side as illustrated. DAPI-stained nuclei and Cy5-mRNAs were shown in blue and red, respectively. (C, D) Bioluminescence images of mice intrathecally treated with FLuc-mRNA-loaded CHE-polyplex (DP = 26, N/P = 5). The FLuc expression was recorded at 4 h (C) and 24 h (D) postadministration into mice (3.0 μg FLuc-mRNA/mouse). White and yellow arrows indicate the sample and catheter injection sites, respectively. (E) Quantitative evaluation of FLuc-mRNA expression level after the intrathecal administration into mice. Results are expressed as mean ± SD (n = 3). (F) CLSM image of brain distribution of Cy5-mRNA/Cy3-sgRNA-loaded CHE-polyplexes (DP = 26, N/P = 5) 4 h after intracerebroventricular injection (1.5 μg Cy5-mRNA and 1.5 μg Cy3-sgRNA/mouse). Cy5-mRNA, Cy3-sgRNA, and DAPI-stained nuclei are shown in red, green, and blue, respectively. (G, H) tdTomato fluorescence images of Ai9 mice intracerebroventricularly treated with SpCas9-mRNA/sgRNA-loaded CHE-polyplexes (DP = 26, N/P = 5). The tdTomato expression was recorded at 2 days postadministration into the mice (1.5 μg SpCas9-mRNA and 1.5 μg sgRNA/mouse). DAPI-stained nuclei and tdTomato are shown in blue and red, respectively. The ventricles were observed by using 10× (G) and 40× (H) objectives.

