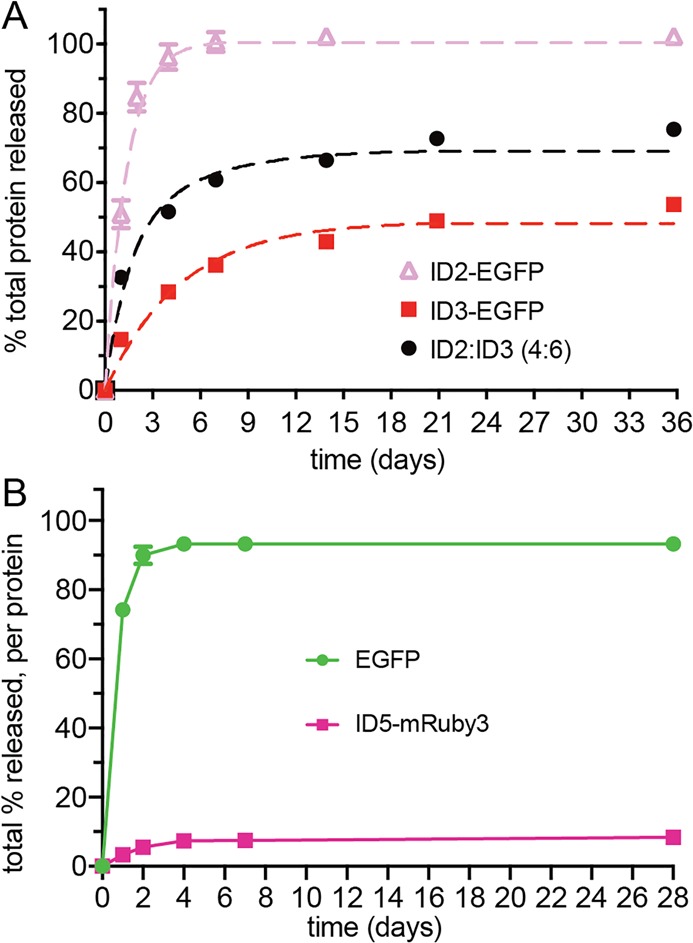
Figure 4.

(A) Release profiles for mixtures of EGFP containing different interaction domains can be predicted, as shown with a 4:6 ratio of ID2-EGFP/ID3-EGFP. First, release data for each pure ID protein was fit to first-order kinetics (dashed pink and red lines), obtained by numerically integrating the equation [Pu]t = k1 [Pb] –k–1 [Pu], where t is time, Pu is unbound protein, Pb is bound protein, and k1 and k–1 are adsorption/desorption rate constants. Fits are linearly combined to predict the release of the mixed system (black dashed line), which agrees well with the experimental data (black circle). (B) Co-encapsulation and staggered release of distinct proteins.
