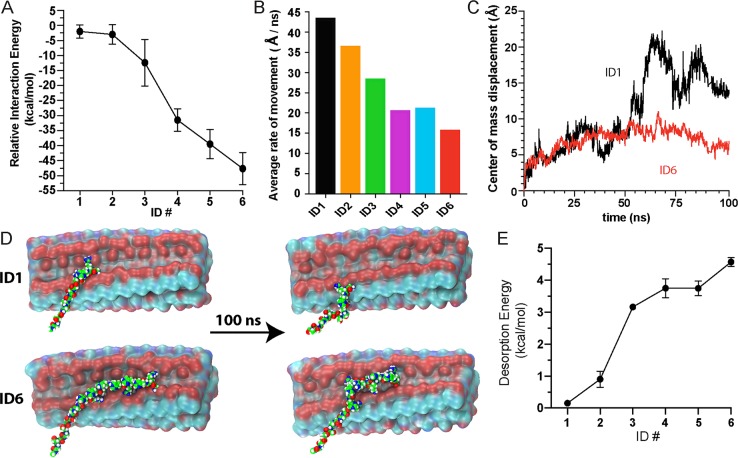
Figure 6.
(A) Computationally determined interaction energies for IDs. (B) Rate of movement for IDs during simulations. (C) Change in the center of mass and (D) visual snapshots before and after 100 ns simulation for ID1 and ID6, demonstrating differences in mobility. (E) Calculated desorption energies for ID-EGFP determined by fitting the Arrhenius rate law (k = Ae(−Ea/RT)) to the release curves in Figure 3A, where k is the rate constant, A is the Arrhenius pre-exponential factor, Ea is the activation (desorption) energy, R is the gas constant, and T is the temperature.

