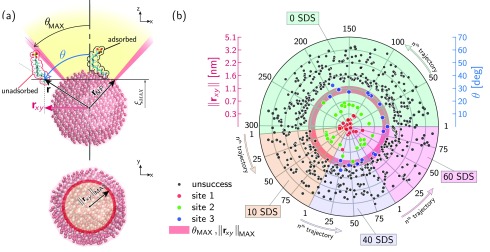
Figure 6.
(a) Frontal and top view of the possible final positions reached by the steered SDS molecule after the pushing process ending at z = ξmax. θ and r are the SDS final spherical coordinates, and rxy is the projection of r in the xy-plane. Defining θmax as the maximum solid angle generated by cutting the NP with the plane z = ξmax, adsorbed and unadsorbed SDS molecules are identified when θ < θmax and θ > θmax, respectively. (b) Polar plot of the steered SDS final positions including all processed trajectories. The total number of trajectories is grouped according to the NP coverage in colored circular sectors whose amplitude is related to the number of pushing trials. The radius of the polar plot indicates the final rxy and intrinsically θ of steered SDS. Black and colored points stand for the unadsorbed and adsorbed molecules onto the NP surface, respectively. Red, green, and blue points identify the three sites of adsorption corresponding to three specific final spherical coordinates of the steered SDS molecule.

