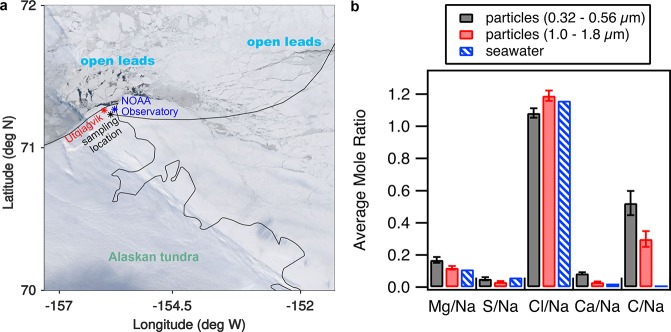
Figure 1.
Observations of open leads and wintertime SSA composition. (a) MODIS satellite imagery from February 26, 2014 (NASA Worldview) shows open leads near Utqiaġvik, Alaska. Locations of the town, NOAA Observatory, and aerosol sampling location are shown. The black line shows 8 h of a NOAA HYSPLIT backward air mass trajectory (February 26, 2014 20:00 AKST; 50 m altitude at the sampling site) passing over the closest open leads before arriving at the site. The air mass traveled ∼60 km from open leads to the northeast. (b) CCSEM-EDX average individual sub- and supermicron SSA particle elemental mole ratios compared to literature values for seawater.40 Error bars denote 95% confidence intervals.

