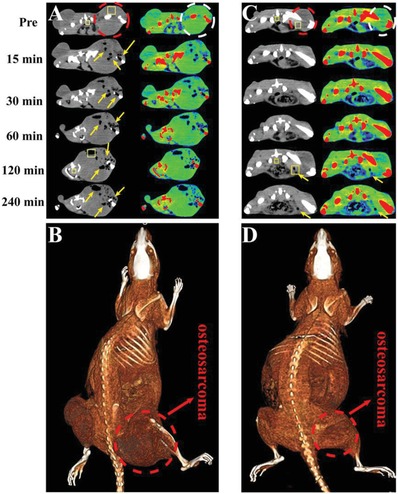
Figure 4.

CT imaging of osteosarcoma‐bearing rats by intratumor and intravenous injection of HMSN@AB@PEG nanoparticles (at several time points). A,C) The intratumor and intravenous transvers gray images and corresponding pseudo‐color images were obtained. B,D) The corresponding 3D reconstruction maps of rat were obtained, intratumor and intravenous. The region of dashed line was the area of osteosarcoma, and the region of arrows was the low CT density area of H2 release. The two rectangle ROI in gray images (one was inside tumor, the other was in normal tissues) were selected to calculate the variation of CT density value between two time points (Pre and 120 min). FOV: 198 × 198 mm, W/L: 300/40.
