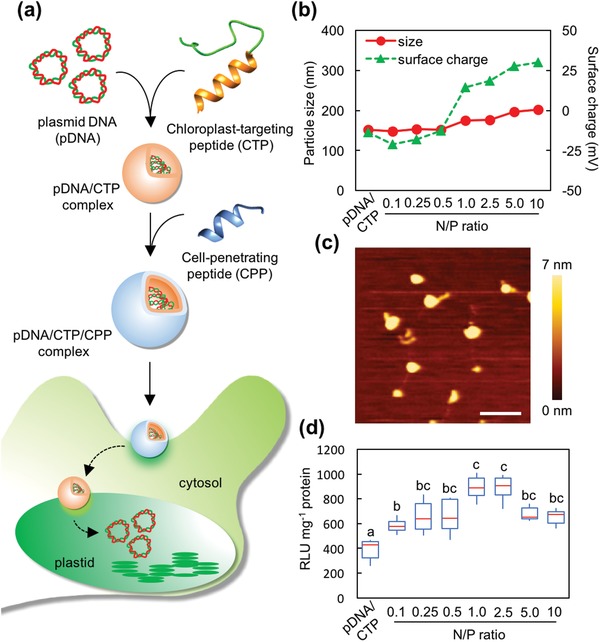
Figure 1.

Formulation of the clustered pDNA/CTP/CPP complexes for plastid transformation. a) Transformation of plastids mediated by the clustered CTP/CPP complexes. b) Particle size and surface charge distribution of the pDNA(pPpsbA::Rluc)/CTP (KH9‐OEP34)/CPP (BP100) complexes at different N/P ratios ranging from 0.1 to 10 and the pPpsbA::Rluc/KH9‐OEP34 complexes at an N/P ratio of 1.0 (pDNA/CTP). Error bars represent the standard deviation (SD) of the average value from three replicates. c) Morphologies of the clustered pPpsbA::Rluc/KH9‐OEP34/BP100 complexes at an N/P ratio of 1.0 under AFM imaging. Scale bar = 500 nm. The color bar from 0 to 7 nm represents the height of the complexes. d) Renilla luciferase activity in A. thaliana leaves syringe‐infiltrated with the clustered complexes formed at different N/P ratios and the complex of pPpsbA::Rluc/KH9‐OEP34 (pDNA/CTP) at 24 h post‐infiltration. The data are presented in the form of a box plot. Red lines represent the median value (n = 6). Maximum and minimum values are presented by the upper and lower bars. Different letters indicate significant differences analyzed by one‐way ANOVA and Tukey's HSD test at p = 0.05.
