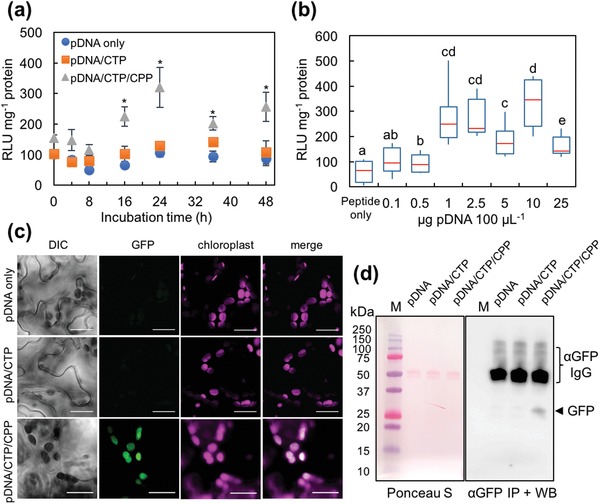
Figure 2.

Expression profiles of reporter proteins in the chloroplasts of A. thaliana leaves delivered using clustered pDNA/CTP/CPP complexes. a) Time‐course analysis of Renilla luciferase activity at different time points after transformation. The pDNA is in the form of pPpsbA::Rluc. The pDNA/CTP (KH9‐OEP34) and pDNA/KH9‐OEP34/BP100 complexes were formed at an N/P ratio of 1.0 with a pDNA amount of 1.0 µg in 100 µL of transformation solution. Error bars represent the SD. Asterisks indicate a significant difference compared to samples infiltrated with pDNA only (Student's t‐test, n = 4, p < 0.01). b) Renilla luciferase activities in Arabidopsis leaves transformed with a clustered pDNA(pPpsbA::Rluc)/KH9‐OEP34/BP100 complex solution (N/P ratio = 1.0) with different amounts of pDNA in 100 µL of transformation solution. The data from eight biologically independent samples (n = 8) for each treatment are shown in the form of a box plot. Red lines represent the median value. Significant differences among treatments, indicated by different letters, were analyzed by one‐way ANOVA and Tukey's HSD test at p = 0.05. c) Transient expression of plastid‐specific GFP in Arabidopsis leaf cells, mediated by the clustered pDNA(pPrrn::GFP(S65T)::TpsbA)/KH9‐OEP34/BP100 complexes, was observed under a confocal laser scanning microscope at 24 h post‐transformation. The autofluorescence of chloroplasts is shown in magenta. Scale bars = 20 µm. d) Verification of plastid‐specific GFP expression in Arabidopsis chloroplasts by immunoprecipitation and immunoblotting. The image on the left shows the equal loading of immunoprecipitated proteins after transfer onto the PVDF membrane and staining with the Ponceau S solution. The image on the right shows the chemiluminescent signal of an HRP‐conjugated antibody against the anti‐GFP antibody used for the immunoblot analysis. Lanes indicated with the letter M are loaded with the dual‐stained Precision Plus protein marker (Bio‐Rad Laboratory). The arrow indicates the GFP (≈27 kDa) band after exposure to LAS3000 for 5 min.
